
EARSC’s extensive engagement with Earth observation user communities has highlighted the need for a common language to help services providers and users arrive at a mutual understanding of the types of services that can be offered and the benefits that can be delivered. We have developed an Earth observation taxonomy that is not only a process of naming and classifying EO services but additionally a tool to improve the understanding between these communities.

The taxonomy includes a generic and comprehensive definition of available products and how these form the basis for the delivery of the EO services (the combination of e.g. EO products, in-situ data, modelling etc.) to deliver contextualized knowledge to citizens, business, government and other organisations. The taxonomy takes a two-sided approach, describing this common list of services from both the suppliers’ and users’ points of view. These two views are interconnected in the figure in your right and described in the links below.
| |
| |
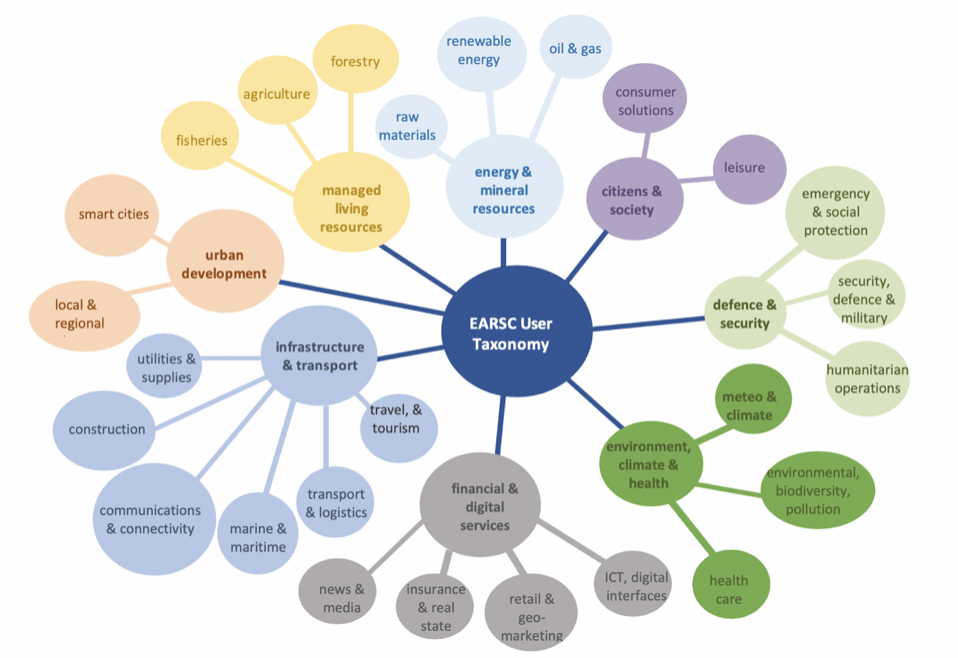
The chart above show the organisation of all EO services from the user’s perspective, i.e. from the market or sector within which any given service would be used. The Market view is organised: - By Market – Services are grouped Into 8 main markets, e.g. citizens, defense & security, infrastructure & transport…
- By Sectors – Each market is split into a number of more specific sectors corresponding to specific niches within that market to which the services apply e.g. the ‘Energy and mineral resources’ market contains the sectors ‘Renewable energy’, ‘Oil & gas’ and ‘Raw materials’. There are 26 sectors in total.
- By sector composition - examples are given of the types of organisation that make up the market sector e.g. users in managed living resources refer to human activities exploiting natural organic resources (users in agricultural commodities, trading, agricultural production and horticulture, agricultural services, agriculture machinery, agriculture and rural development policies, etc. This helps define the sector and its EO-related needs.
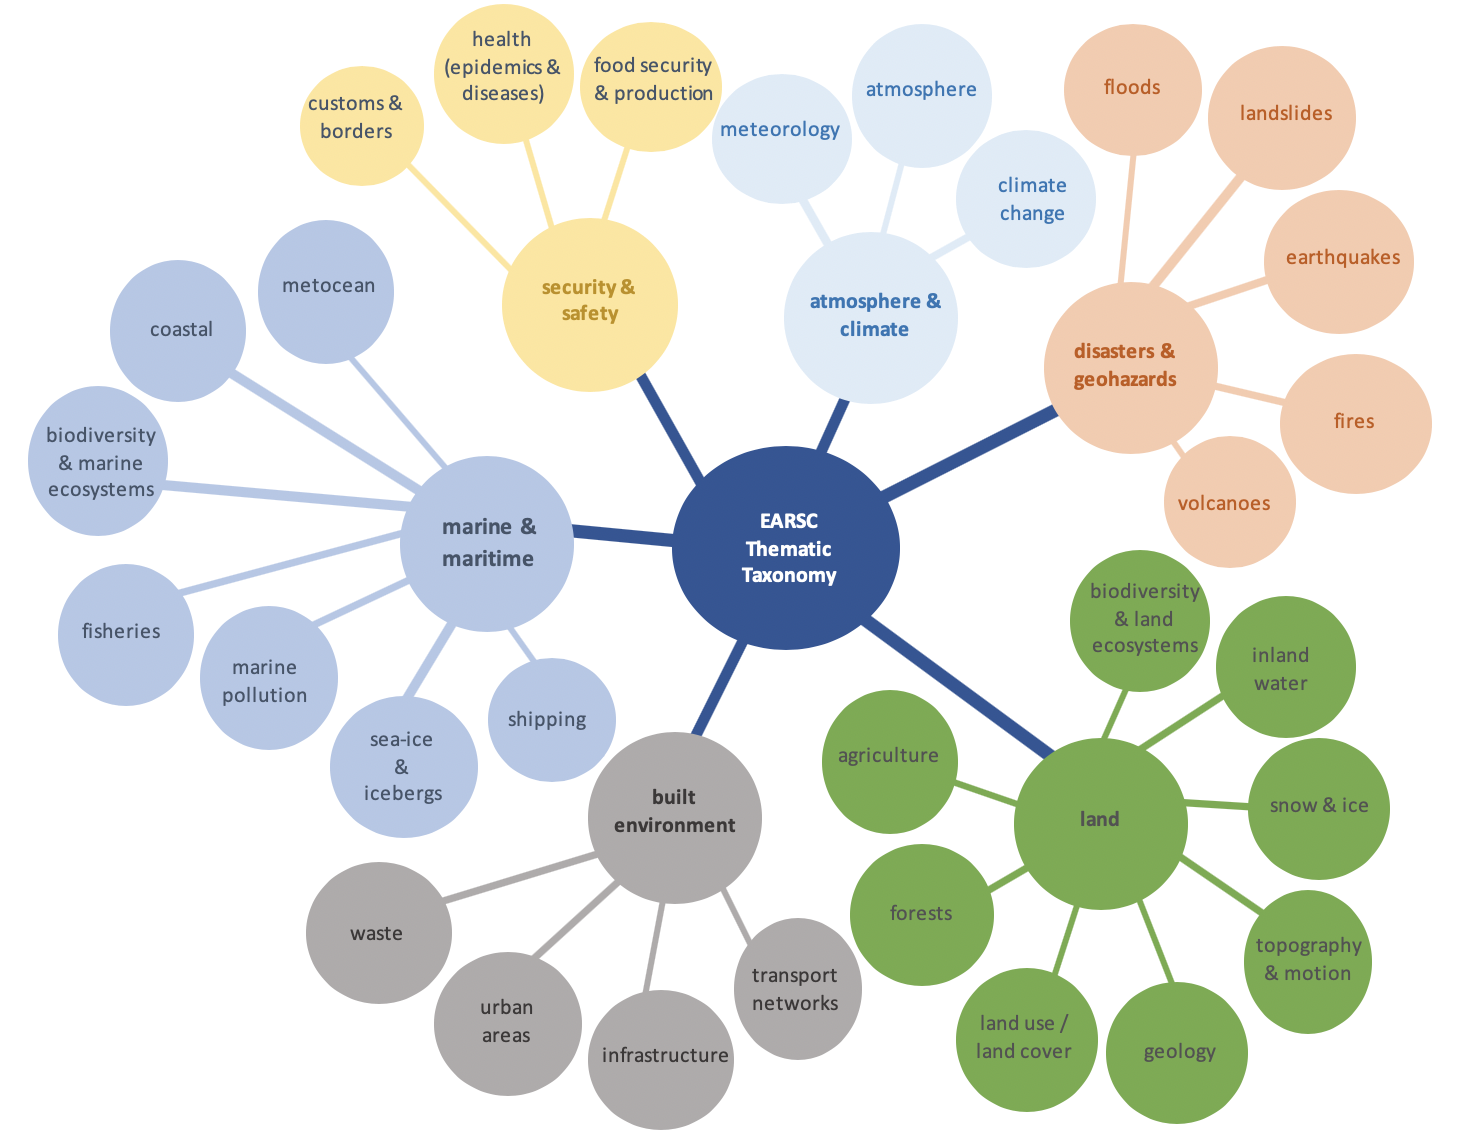
| The chart above shows the organisation of all EO services from the supplier’s perspective. The Thematic view is organised: - Into 6 main Domains (or classes) - This refers to the various applications of EO technologies and stems from the different scientific schools from which different approaches have developed, e.g. marine applications have been developed by a different community than geohazard or atmospheric products.
- By Areas - These Domains are then split into 32 thematic segments (or Areas) below that showing specialisations within those field, e.g. within the Marine Domain we include Areas on the detection of ships, marine pollution, sea ice…
- By service descriptions and keywords – a non-exhaustive list of keywords are provided for each Area that help to define that Area. These keywords are presented in relation to a fixed set of verbs that describe the action undertaken in the service, e.g. monitor, detect, track, assess… For a full description of these (87 EO services) see either the reduced or extended descriptions linked to above.
|
For more information contact Monica Miguel-Lago
Previous EARSC Taxonomy (v2015)
This page has no comments.