In 2008 GeoVille was contracted by Sanford C. Bernstein to conduct a study examining the drilling activity over the Ghawar oilfield, one of the largest conventional oilfields in the world (Figure 1).
The aim of the project was to analyse the performance and assess the efficiency of the Ghawar oilfield based on multi-temporal high-resolution optical satellite imagery. Especially drilling and construction activities, i.e. position and number/density of rigs working in the oil fields, were mapped for different points in time throughout the Ghawar oilfield. Furthermore, rig spacing and location of the rig activity within the field gave indication of what the oil producer was doing and how intensive the company was developing the field in this time period.
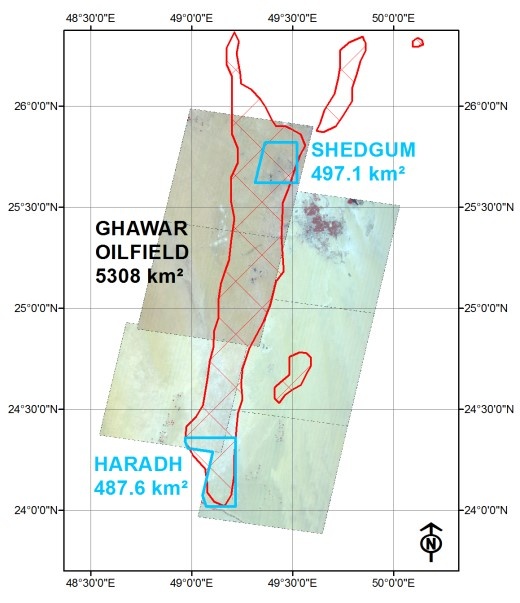
Figure 1: Case study area – Ghawar oil field
The Ghawar oilfield is by far the largest conventional oilfield in the world. Production exceeds almost 5 million barrels per day, with the north of the field around Shedgum being the most mature. In 2008, Sanford C. Bernstein, a Wall Street's premier sell-side research and brokerage firm, partnered with GeoVille Information Systems GmbH to conduct an oilfield performance study in the Ghawar oilfield.
The main objective of the study was to analyse the oilfields current oil production and to forecast its performance in the near future. For this detailed analysis Sanford C. Bernstein required information on the current drilling and construction activities relative to the location and density of past activities. This included information on the position and number of rigs at Ghawar oilfield in 2007 in comparison to the location and density of rigs in the preceding decades. Since ground data is sparse, new optical satellite-based technologies provided an innovative and efficient approach to derive this information.
Optical satellite images from ASTER and SPOT have been acquired for mapping and very high-resolution Quickbird satellite imagery for validating the oil exploration and production related infrastructure, e.g. production sites and drilling rigs in the Ghawar region. An example of the used satellite imagery is given in Figure 2.
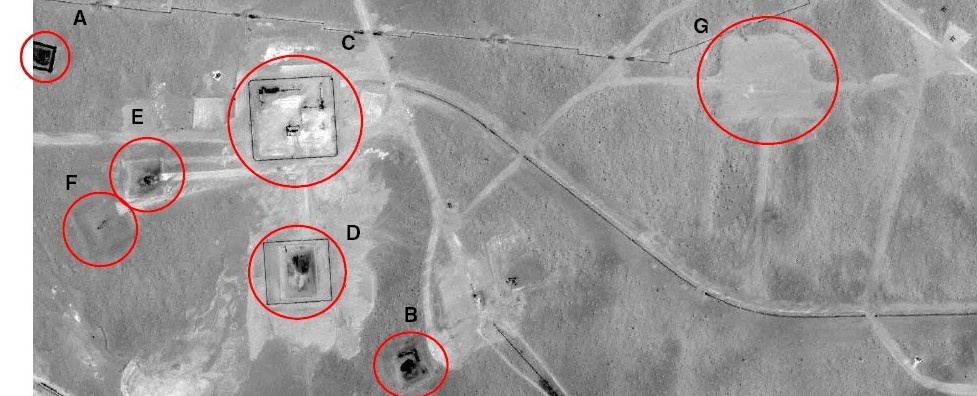
Figure 2: QuickBird satellite image highlighting oilfield infrastructure
In a first step, oil exploration and production related infrastructure (production sites and drilling rigs) were mapped in almost the complete Ghawar oilfield for the years 2004 and 2007. Some areas were identified showing significant changes in activity between 2004 and 2007. Thus, two of these areas – Shedgum in the North, and Haradh in the South – were chosen as “hot spot areas” for a further, more detailed analysis based on ASTER satellite data.
Special emphasis was laid on the validation of the derived point locations. For this purpose the Shedgum area was selected and another reference interpretation was created using 2006 SPOT satellite imagery. The resulting map was then validated using very-high resolution Quickbird imagery.
Shedgum
The Shedgum hot spot area is situated in the northern part of the main Shedgum oilfield, approximately 40 kilometres northwest of the largest city in the region, Al Hofuf. The settlement closest to the Shedgum area is Al Jadidah, just next to the north eastern border of the main Ghawar oilfield. The delineation of the Shedgum mapping area follows geographic latitude / longitude parameters in the North (25,82°N), East (49,52°E) and South (25,62°N), while the western border follows the coverage of the acquired 2001 Aster satellite image. Thus, the present delineation marks the common coverage area of all time lapse mapping satellite images (2001, 2004, 2006, 2007).
In order to validate the quality of the mapping product for 2006 in Shedgum, a very high-resolution panchromatic QuickBird scene (ground resolution 0,7m) for the same year (2006) and area (Shedgum) was ordered and analysed.
Haradh
The Haradh hot spot area covers the southernmost part of the main Ghawar oilfield, approximately 150 km southwest of the city of Al Hofuf. The delineation of the Haradh mapping area follows geographic latitude / longitude parameters in the North (24,26°N), East (49,22°E) and South (24,02°N), while the western border follows the coverage of the 2004 Aster satellite images. Thus, the present delineation marks the minimum coverage area of all time lapse mapping images (2004 / 2007).
Mapping of Oil Infrastructure
Experience from analysis of ASTER optical imagery showed that features or objects which are recognizable on the surface have the following characteristics:
- a size above some multiples of pixel size (e.g. small settlements),
- a shape different from common “natural” objects (e.g. roads),
- a colour different from the background
One rectangle black feature has been found to be present at nearly all production sites. This feature has been selected as an indication for production sites. Access gravel roads and prepared ground on drilling/production sites could not be detected. Comparison of the ASTER and SPOT image data over Shedgum revealed a slightly improved recognisability of these features due to the improved spatial resolution of 10 m for the panchromatic image data.
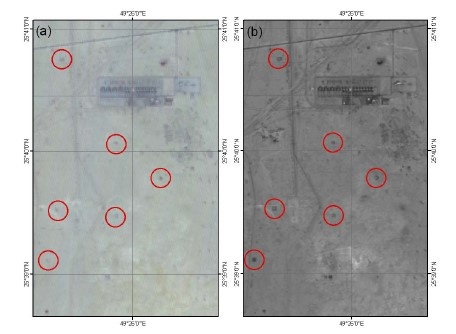
Figure 3: Mapping of potential oil production sites– (a) results based on ASTER data from 2004; (b) results based on SPOT-2 data from 2007
Based on the already approved mapping approach, further time-lapse mapping of oil-related infrastructure was performed in
- the Shedgum area for the years 2001 (using ASTER) and 2006 (using SPOT) and
- the Haradh area for the year 2007 (using ASTER)
The existing point maps of oil-related infrastructure for 2004 and 2007 served as starting points for down- and updating towards the target dates. Mapping of the objects was done and resulting point maps were compared and analysed. Validity of the mapped features was persistently checked in GoogleEarth. From the point maps of the oil-related features all points have been extracted (i.e. those which are absent in the previous date) and removed (i.e. those which are absent in the more recent imagery).
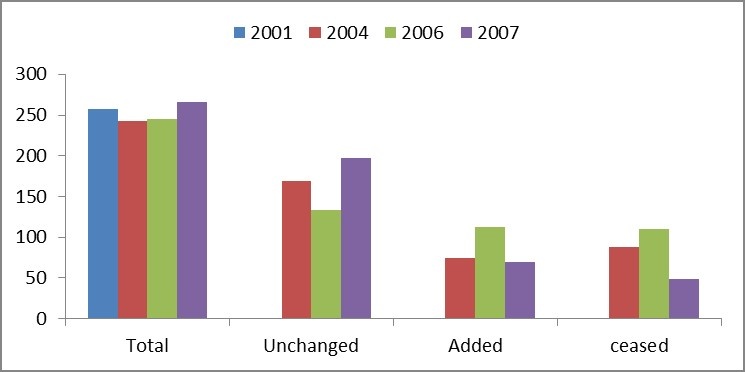
Figure 4: Count of oilfield objects in Shedgum from 2001 to 2007
In total 1856 objects were mapped for the entire Ghawar oilfield. The overall figures for Ghawar show that between 2004 and 2007 the majority of all infrastructure objects remained unchanged (1193 sites), while approximately one third of all objects was removed (663 out of 1856 sites), and an even higher number of objects was newly built (846 sites). This results in a total number of 2039 infrastructure objects for the year 2007.
The results in Shedgum show that the overall number of objects remained relatively stable from 2001 to 2007 with only minor deviations. From 2001 to 2004 the total number of objects decreased slightly by 14 objects, while in the following time steps there was a steady increase from 243 in 2004 to 253 in 2006 and 266 in 2007. However, deeper analysis revealed a significant fluctuation of added and ceased objects in that particular area. Between 2001 and 2006 the number of removed objects was always higher than the number of added objects. This trend turned between 2006 and 2007, where 57 new objects were created and only 27 objects were removed.
In the Haradh mapping area a significant increase of oilfield objects was detected from 86 objects in 2004 to 147 objects in 2007. Only 9 objects were ceased as opposed to 73 new objects between 2004 and 2007. While many locations remained unchanged over the years, a notable number of features was newly established or removed during the observed time period.
Figure 5 visualises the status of object-related infrastructure for the years 2001, 2004, 2006 and 2007. While many locations remain unchanged over the years, a notable number of features was newly established or removed during the observed time period.
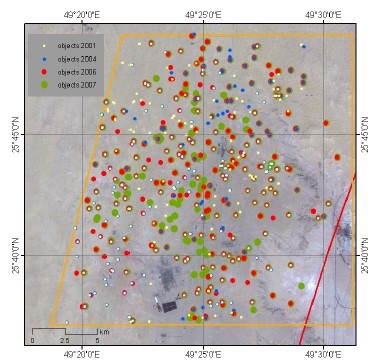
Figure 5: Time-lapse maps of oil-related infrastructure in Shedgum: Aster 2007 image overlaid with point locations 2001, 2004, 2006 and 2007
Density net change maps of oilfield objects
After finalizing the mapping of point locations, further GIS raster processing was applied to derive density net change maps of production sites for the Shedgum and Haradh hotspot areas.
Density analysis in GIS takes the mapped object locations and spreads it across the landscape by deriving a continuous raster surface. Density surfaces are therefore well-suited for showing where point features are concentrated.
Oilfield objects density maps were derived from the point locations through interpolation to a continuous raster surface. For calculation, only added/removed objects were taken into account, unchanged objects were not used for calculation of the density net change maps.
The cell size of the resulting density surfaces was set to 0,0001 degrees (approx. 11 m). For calculation a radius of 0,03 degrees (i.e. approx. 3300 m) around each point feature was chosen, i.e. within this distance the algorithm searches for points. Finally, each resulting cell value is normalized by relating the counted number of points to a 100 x 100 km square. The size of the square is chosen to avoid no-data gaps during interpolation inside the point cloud and to steer the degree of generalization
Figure 6 and Figure 7 show the individual density maps of added/removed objects as input for further calculation of the density net change maps in Shedgum and Haradh.
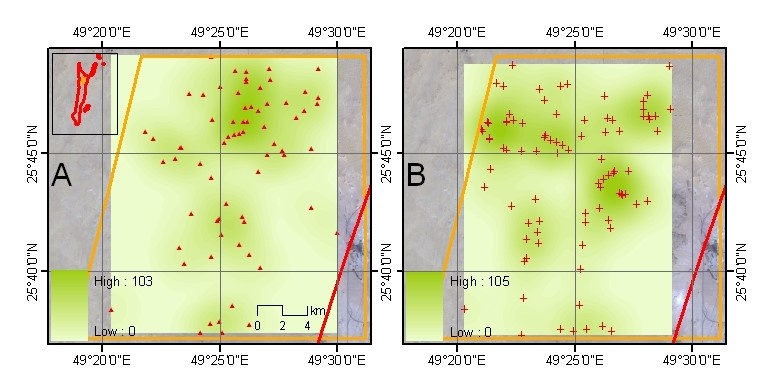
Figure 6: Single density maps of point locations in Shedgum: added (74) (A) and removed (88) objects (B) between 2001 and 2004
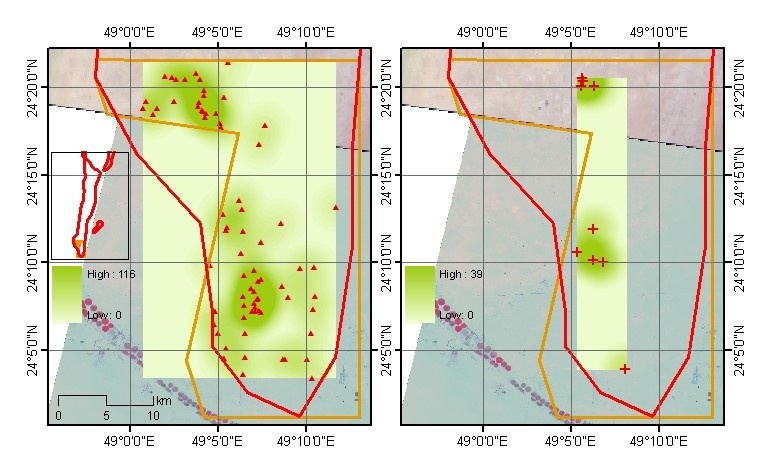
Figure 7: Single density maps of point locations in Haradh: added (70) (left) and removed (9) objects (right) between 2004 and 2007
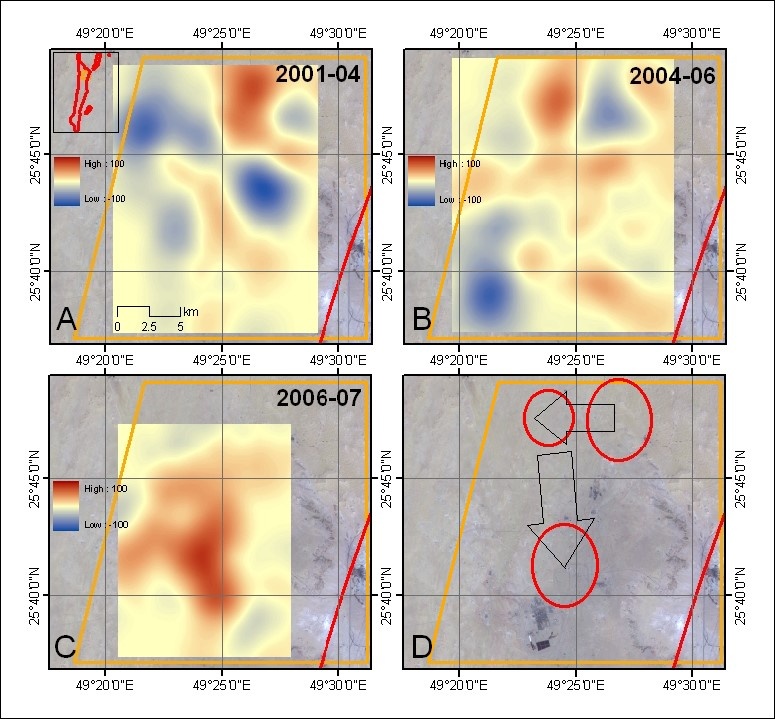
Figure 8: Density net change maps of oil production sites in Shedgum for the time periods 2001-2004 (A), 2004-2006 (B) and 2006-2007 (C); the bottom right figure shows areas with a significant shift of activities (D); Explanation: red = increasing activity; blue = decreasing activity; yellow = no changes; Values indicate the absolute increase / decrease of oilfield objects related to a 10x10 km surrounding square (a value of 100 equals 100 objects per 100 km² or 1 object per km²)
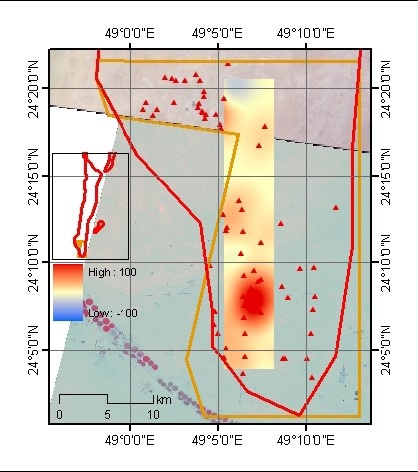
Figure 9: Density net change maps of oil production sites in Haradh for the time period 2004-2007. Explanation: red = increasing activity; blue = decreasing activity; yellow = no changes; Values indicate the absolute increase / decrease of oilfield objects related to a 10x10 km surrounding square (a value of 100 equals 100 objects per 100 km² or 1 object per km²).
Density net change maps were derived calculating the difference between added and removed objects in Shedgum (2001 to 2004, 2004 to 2006, 2006 to 2007) and Haradh (2004 to 2007). The maps indicate the status and development of drilling activity in the Shedgum oilfield and reveal a spatial shift of production activities towards the south.
The density net change map in Haradh shows a considerable increase of activity in the southern part (Figure 9). Due to the spatial convergence of removed point locations the interpolation surface only covers a relatively small strip inside the Haradh area.
Satellite-based remote sensing using optical images proved to be a valuable tool for drawing conclusions on oilfield production activities. Satellites enable the detection of oil exploration and production related infrastructure, e.g. production sites and drilling rigs.
The use of multi-temporal satellite imagery as applied in this study for the years 2004, 2006 and 2007, reveals useful information on the distribution and development of oil-related infrastructure over time, which is essential to assess the performance of the Ghawar oilfield. The validated results of the study provide strong evidence that there are ongoing activities in the Ghawar field leading each year to an increased number of oilfield objects throughout the entire field. In Shedgum the trend of removing more objects than adding new ones observed between 2001 and 2006 turned into a surplus of 30 new objects between 2006 and 2007.
As a conclusion, the mapping approach revealed an excellent performance and can be easily applied to other oilfields.
Contact
GeoVille is a private sector enterprise located in Austria and Luxembourg. GeoVille specialises in products and services related to Earth Observation (EO) and Geographic Information Systems (GIS) applications.
GeoVille is Europe’s leading company in using satellite data for land monitoring and spatial planning applications.
Our services provide the bridge from user needs to technical implementation - merging geospatial explicit data with statistics - to the analysis of what on-going processes and trends mean for real world applications.
GeoVille Information Systems GmbH
Sparkassenplatz 2, 3rd floor
A - 6020 Innsbruck
Austria
Email: info@geoville.com
Web: www.geoville.com
This page has no comments.