EO success story to help understand near-surface effects on seismic data
The new method uses satellite-based data such as radar, Landsat 7 and ASTER in this Berkine basin case study. | 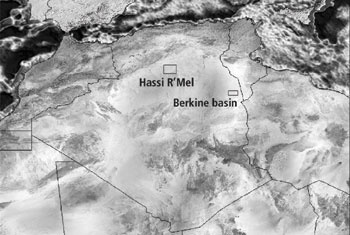 Fig1. Location of the Hassi R'Mel and Berkine basin test sites in Algeria. |
Estimation of surface characteristics from EO data is an emerging technology. It is useful for various purposes, including mapping of surface mineral deposits, flood monitoring and infrastructure planning. Satellites are equipped with sensors that measure reflected energy in visible-to-infrared wavelengths, radiated thermal infrared energy, and radar backscatter information about the earth's surface. Combining these data allows characterization of different types of surfaces. The algorithms for extracting certain surface characteristics are well known (see article page) |
|
Impact of surface features on seismic |
|
Data flow for seismic data quality
The Earth Observation (EO) based analysis is aimed at providing a geographically accurate seismic quality map that is based on surface and near-surface features compiled from a combination of EO and derived data. Such maps reduce the risk of acquiring poor-quality seismic data. They can be used before data acquisition and during data processing, when modeling provides a description of the elastic properties of the near-surface for statics corrections.
The main EO requirements were to ensure ± 50-m geographical accuracy and the ability to acquire, merge and mosaic multi-temporal imagery. Earth Radar Satellite (ERS) data were required for textural mapping and analysis of surface moisture. Landsat 7 ETM+ was used to ensure geographical accuracy and for detailed interpretation of faults and fractures, drainage and lithology. ERS is an active microwave sensor that operates at 5.3 GHz and 5.6 cm wavelength. The satellite has the advantages of being able to acquire imagery both day and night and to see through clouds. Radar data are particularly sensitive to variations in topography, surface roughness and moisture.
The integration and analysis stages involved generating multiple image layers, such as a single ERS image for textural analysis and interpretation of surface faults and fractures, and a derived principal component analysis of multi-temporal ERS data for analysis of surface moisture. The seismic quality modeling was performed using all the thematic layers within ArcGIS and exported into the ArcView project.
Based on the results of the Algerian case study, it is clear that ERS Synthetic Aperture Radar (SAR) data alone does not meet all the requirements regarding planimetric accuracy and spatial resolution. In many cases, radar data must be supplemented with optical data. In this case study, both Landsat 7 ETM+ and ASTER data were used.
Case Study: BERKINE BASIN, ALGERIA
Basin characteristics. In the Hassi R'Mel area, the data quality estimation study focused on structural features such as brittle fractures and surface moisture, which has a strong impact on sensor coupling in loose sediments.
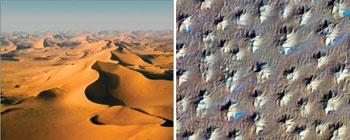
Berkine basin is dominated by sand dunes of up to 200 m in height that have a considerable impact on surface seismic acquisition logistics and data quality. The delineation and qualification of sand dunes and interdune gypsum fields prior to the design would benefit seismic survey planning, efficiency and results. Satellite imagery provided useful surface mapping for these objectives. The initial results were presented by the authors at a PESGB London Evening Meeting in September 2003.
Large sand dunes are frequently composed of a stationary star dune, which is oriented along the mean wind directions. Located on top of the star dune are smaller half-moon-shaped barchan dunes, which consist of mostly unconsolidated sand and constantly change their shape. Barchan dunes were found to cause significant degradation of surface seismic data.
Satellite data analysis
Landsat 7 ETM+ and ASTER data consist of 8 and 15 spectral bands, respectively, from the visible, near-mid infrared and thermal infrared parts of the electromagnetic spectrum. These datasets provide imagery with ground resolutions ranging from 15 to 90 m. Individual and combinations of the spectral bands can be processed and enhanced to highlight variations in lithology and mineralogy that may impact seismic data quality at both the acquisition and processing stages. In addition, the ERS SAR data provide an indication of the relative roughness and moisture content of the ground surface. ERS radar can also penetrate 0.5 – 1.0 m through dry granular surface materials and may provide information related to buried, near-surface geological structure or rock.
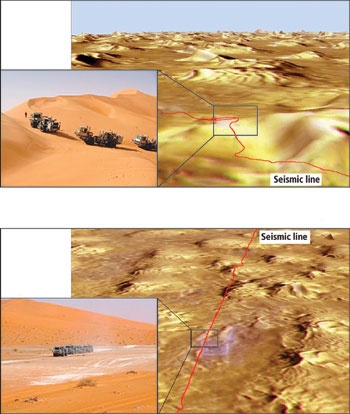
ASTER data includes two 15-m panchromatic bands acquired in a stereo mode and have been used to generate a DEM of the area. The DEM provides information on dune height relative to the interdune areas and can be calibrated using field-based GPS at the seismic acquisition stage. The DEM was processed to highlight the gradient of the dunes and was used to create a fly-through of the area for evaluating the seismic acquisition.
Analysis and integration of these datasets were used to identify areas where a reduction in the seismic data quality might occur as a result of overly steep surface slopes and loose, unconsolidated sand associated with dunes. These areas cause problems related to elevation statics and strong attenuation of the seismic signal. The spectral information of Landsat 7 ETM+ and ASTER data also identified interdune areas associated with exposed gypsiferous material, Fig. 8b. Areas where the gypsiferous layer is buried beneath encroaching wind-blown dune sand could also be inferred. The presence of a gypsum layer at or near the ground surface introduces a strong absorption problem and can also create problems related to source coupling during acquisition.
Vibrator quality control. The vibrator source signal quality is monitored by the control electronics and captured in Post-Service Sweep (PSS) attributes, which are stored for later quality control. Characteristic data such as the force and the distortion of the sweep are stored and can be accessed for quality assessment. On soft terrain, when the vibrator baseplate loses support and sinks into the ground, the control electronics compensates with increased force. As a result, the fidelity of the sweep (measured as distortion) degrades, indicating a data quality problem.
For analysis, the QC attribute derived from force and distortion of the vibrator signal was used to establish the reference for the seismic data quality
The data flow for future projects that employ satellite imagery for improvement of survey design can now be drafted: The integration of satellite data with seismic data first requires both data to be georeferenced. Next, the satellite data processing extracts the attributes from the data, which then are calibrated by the QC data from legacy seismic data. The calibrated data are plotted into dense seismic attribute maps, which can be used for survey design and logistic planning. The surface geological characterization provides an initial model for the weathering layer model in seismic data processing
The seismic QC data have been used to validate the observations made from satellite imagery and the derived DEM. In particular, the comparison shows a contrast between dune morphology across the study area reflecting the transition from the stable, more consolidated star dunes to the more mobile, less consolidated rounded sand mounds. A reduction in seismic data quality was also observed in areas identified as containing gypsum from the spectral data of Landsat 7 ETM+ and ASTER satellite data. The successful correlation between the satellite-based analysis and the field vibroseis QC data suggests that the relationships can be extrapolated into other dune areas in the Berkine basin. The methodology can be used to optimize the acquisition geometry for data quality in sand dune areas.
Article extracted from WorlOil September 2004
Authors, Andreas Laake (WesternGeco) and Martin Insley (Infoterra) in 2004
Acknowledgements: Infoterra, WesternGeco, Anadarko, ESA
This page has no comments.