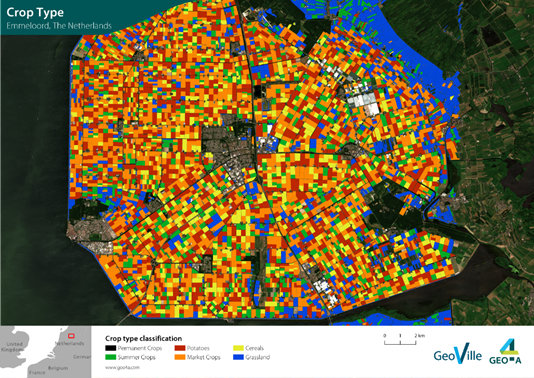
Crop types in a selected area of interest (Emmeloord, The Netherlands) (Source: GeoVille/Geo4A) | ||||||||||
Category | ||||||||||
|
|
|
|
| ||||||
PRODUCT DESCRIPTION | ||||||||||
The crop type detection service provides information on types and location of crops grown with different levels of detail. Besides summer and winter crops, various types such as potatoes, maize, cereals, and others field crops can be detected using Earth observation techniques. The classification of crop types is performed by using spectral information and temporal information about crop development. With this information it is possible to separate accurately different crop classes over large areas. To identify the different crop types a long and consistent time series of satellite imagery is needed. Taking a close look on the fields over a growing season is important as the differences between the crops become apparent based on their phenological development over the season. The later in the season, the more accurate the identification of crops gets, as there is more information available and the vegetation differences are more clearly recognisable. Optical as well as radar satellites are used for this service. Radar imagery such as Sentinel-1 provide information on structural properties of crops and therefore optimise the results. Furthermore, the limitation of optical data due to cloud coverage can be overcome using radar data. Different levels of detail are possible: analysis may be performed on pixel or parcel level; also, generic grouped classes as well as specific crop types are feasible. The service is applied within a specified area of interest. Analysis is possible in different regions with some region-specific adjustments. To distinguish the different crop types more accurately, training data from regions and within the season is needed. | ||||||||||
PRODUCT SPECIFICATIONS | ||||||||||
Main processing stepsSatellite Data -> Pan-sharpening / resolution merge -> Indices calculation -> Statistics Calculation -> machine learning algorithms | ||||||||||
Input data sourcesOptical: Sentinel-2, Landsat-7, Landsat-8, or commercial VHR / HHR satellite data Radar: Sentinel-1 Supporting data: Field parcel delineation; in-situ crop type information such as LPIS | ||||||||||
Spatial resolution and coverageSpatial resolution: 10m Coverage: Regional/national level Availability: Globally available | ||||||||||
Accuracy / constraintsThematic accuracy: variable, >90% for major crops and crop groupings (end of season) Spatial accuracy: 1.5 - 2 pixels of input data | ||||||||||
LimitationsMachine learning datasets are highly dependent on their input datasets. The crop type classification can be improved with available in-situ data. | ||||||||||
Frequency / timelinessFrequency: various time steps Timeliness: from the beginning of the respective growing season | ||||||||||
Delivery / output formatData type: GIS-ready data formats; Raster; API (depending on customer needs) File format: GeoTIFF | ||||||||||
AccessibilityCommercially available on demand from EO service providers. | ||||||||||
CHALLENGES ADDRESSED - USE CASE(S) | ||||||||||
Product Development
Product Sales:
Underwriting
Loss Adjustment
Claims Handling
| ||||||||||

Overview
Community Forums
Content Tools
This page has no comments.