Valorising long-term ecosystem research sites and associated in-situ data
| Sponsor | Project | Solution provider | User |
|---|---|---|---|
|
| Protected Area Managers, Scientists, Environmental Assessment Agencies, restoration EU policy |


- Environmental, biodiversity, pollution
- Meteo & climate
- Education, training & research
- ICT, digital interfaces
- Local & regional planning
Main users of the services provided by the mySite pilot are researchers, site and protected area managers as well as the wider public. The main user is characterised by the need to access information on long-term observations collected on dedicated areas. These are either long-term observation facilities or protected areas. This is reflected either by the research community applying scientific analysis for the given areas or protected area managers informing about the status of areas of interest in order to perform daily management.

DEIMS-SDR is a web-catalogue for long-term observation facilities and data and as service adopted by the eLTER network and operated and maintained by the Umweltbundesamt GmbH (Austria). EcoSense is webGIS to visualise spatial and time-series information and as service adopted by the eLTER network and operated and maintained by the BioSense Institute (Serbia)
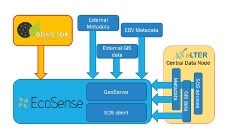
DEIMS-SDR and EcoSense provide services for users to document and visualise information on long-term observation facilities as well as data gathered at these locations. EcoSense provides a on-stop interface to access this information and to visualise collected information. User stated "it is a very important new step for DEIMS-SDR and for eLTER!!! Congratulation."
When dealing with Earth Observation data pipelines as well as scientific analysis the use of in-situ data as well as understanding the context of observation is an important issue. This applies e.g. for the integration and use of in-situ datasets to produce meaningful value added EO data products. Providing services to register and document long-term observation facilities as well as the data collected and providing means to visualise and access them in an easy manner was one of the main aims of the mySite pilot. This should allow for the integration of in-situ data as well as EO data products generated for a given area. This not only supports scientific workflows but also supports the management of selected areas, e.g. protected areas, to support daily management.
Information on long-term in-situ data is provided via multiple platforms ranging from local offline data descriptions to national network scale metadatabases. Thus, in-situ datasets are not ubiquitously available but must be made findable and accessible, yet conserving associated data rights and licenses. In addition, information on the observation context needs to be provided in order to plan and conduct scientific analysis or plan targeted observation. This also includes to provide sufficient and comprehensive information on relevant long term data sources and observation sites across different domains and biogeographic gradients as well as to provide access to easily retrievable, localised (=site-based), and standardised validated biodiversity and ecosystem data. In order to address these challenges, DEIMS-SDR has been developed to document long-term observation facilities and datasets as well as EcoSense as a visualisation and access interface to support the user needs.
The benefits of the Agrowth platform are the following:
- It estimates the current phenology stage of crop and the fuzzy transition of them in the course of time. → Producer/Farmer knows every time in what stage his/her crop is and he/she is able to take action.
- It provides a heatmap for the sowing period of cotton which estimates daily the risk(high/medium/low) → Producer/Farmer has an indication about the right time of sowing, he/she is able to catch the possible sweet early window of April for cotton sowing.
- It predicts the yield in kg/ha, weeks earlier from the harvest. → Producer/Farmer has a good estimation of yield weeks earlier.
- It provides charts for the evolution of the vegetation indices NDVI, NDWI, PSRI and some crop specific indices. → Producer/Farmer has a good indication in order to monitor the vegetation health and the moisture of the crop.
- It visualizes the max and min ambient temperatures per parcel and it interplays with risk.resagri.eu. → Producer/Farmer has access to ResAgri’s detailed weather information in a 2km x 2km spatial resolution.


Learn more about the service:
Learn more about e-shape: www.e-shape.eu
A question? Contact the Helpdesk: https://helpdesk.e-shape.eu
This page has no comments.