DynaCrop is integrating EO to digital farming for higher yields, easier decisions, and more joy of farming. It harnesses power of EO to foster the data-driven change across the food value chain
| Sponsor | Project | Solution provider | User |
|---|---|---|---|
|
|  | farms and agricultural enterprises |


Agriculture
land use/land cover
biodiversity
land ecosystem
Agdata.cz provides a cloud system (SaaS) for comprehensive digitization of farms and agricultural enterprises. We combine data from many sources such as GPS units, weather stations, agricultural sensors, satellite imagery, forecasting models and more to help farmers make better decisions. Agdata is an open system that can be easily integrated with existing customer systems (payroll, accounting, weight, fuel, etc.).

DynaCrop is integrating EO to digital farming for higher yields, easier decisions, and more joy of farming. It harnesses power of EO to foster the data-driven change across the food value chain.
DynaCrop is a white-label ecosystem enabling companies in food value chain to use advanced information, statistics and intelligence based on EO. It provides ready-made crop monitoring, field statistics, application maps and soil moisture assessment on a global scale. Information is delivered through value-added platform (API, white label web application, QGIS plugin) and client is receiving sales support, user-centric consulting and R&D cooperation as part of the cooperation.
Instead of building another solution for farmers, DynaCrop pursues a synergy with companies already established in the food value chain and help them to integrate EO-based information at scale. In this way, it minimizes resources needed for EO integration (money, time, human resources) and provide clients with state-of-the art service and consulting at low costs.
We use the DynaCrop service as a main source of satellite products. We appreciate the reliability of the service, cheap price and flexibility of the DynaCrop team that is always ready to solve our issues and consult our ideas.
The food production sector must undergo a major change in order to sustain food production for a growing population and turn sustainable and carbon-neutral at the same time. Earth Observation is bringing tools that support the transition, but their adoption is slow due to the high complexity of the issue.
DynaCrop service is currently fully operational. Therefore, the main technical challenges are in extending the service further.
The key issues consist of:
- Providing information in periods with high clouds occurrence. We are developing a multisensor data fusion vegetation ndex (Sentinel 1,2,3 + weather) using combinations of recurrent, neural and GAN networks.
- Providing reliable extrapolation of soil organic carbon content based on fusion of EO and soil sampling
- Extract and flag substantive anomalies in EO-based filed statistics and vegetation dynamics.
Another technical challenge lies in optimizing methods for effective scaling up of the underlying infrastructure in moments with rapid increase in demand from customers.
The benefits of the Agrowth platform are the following:
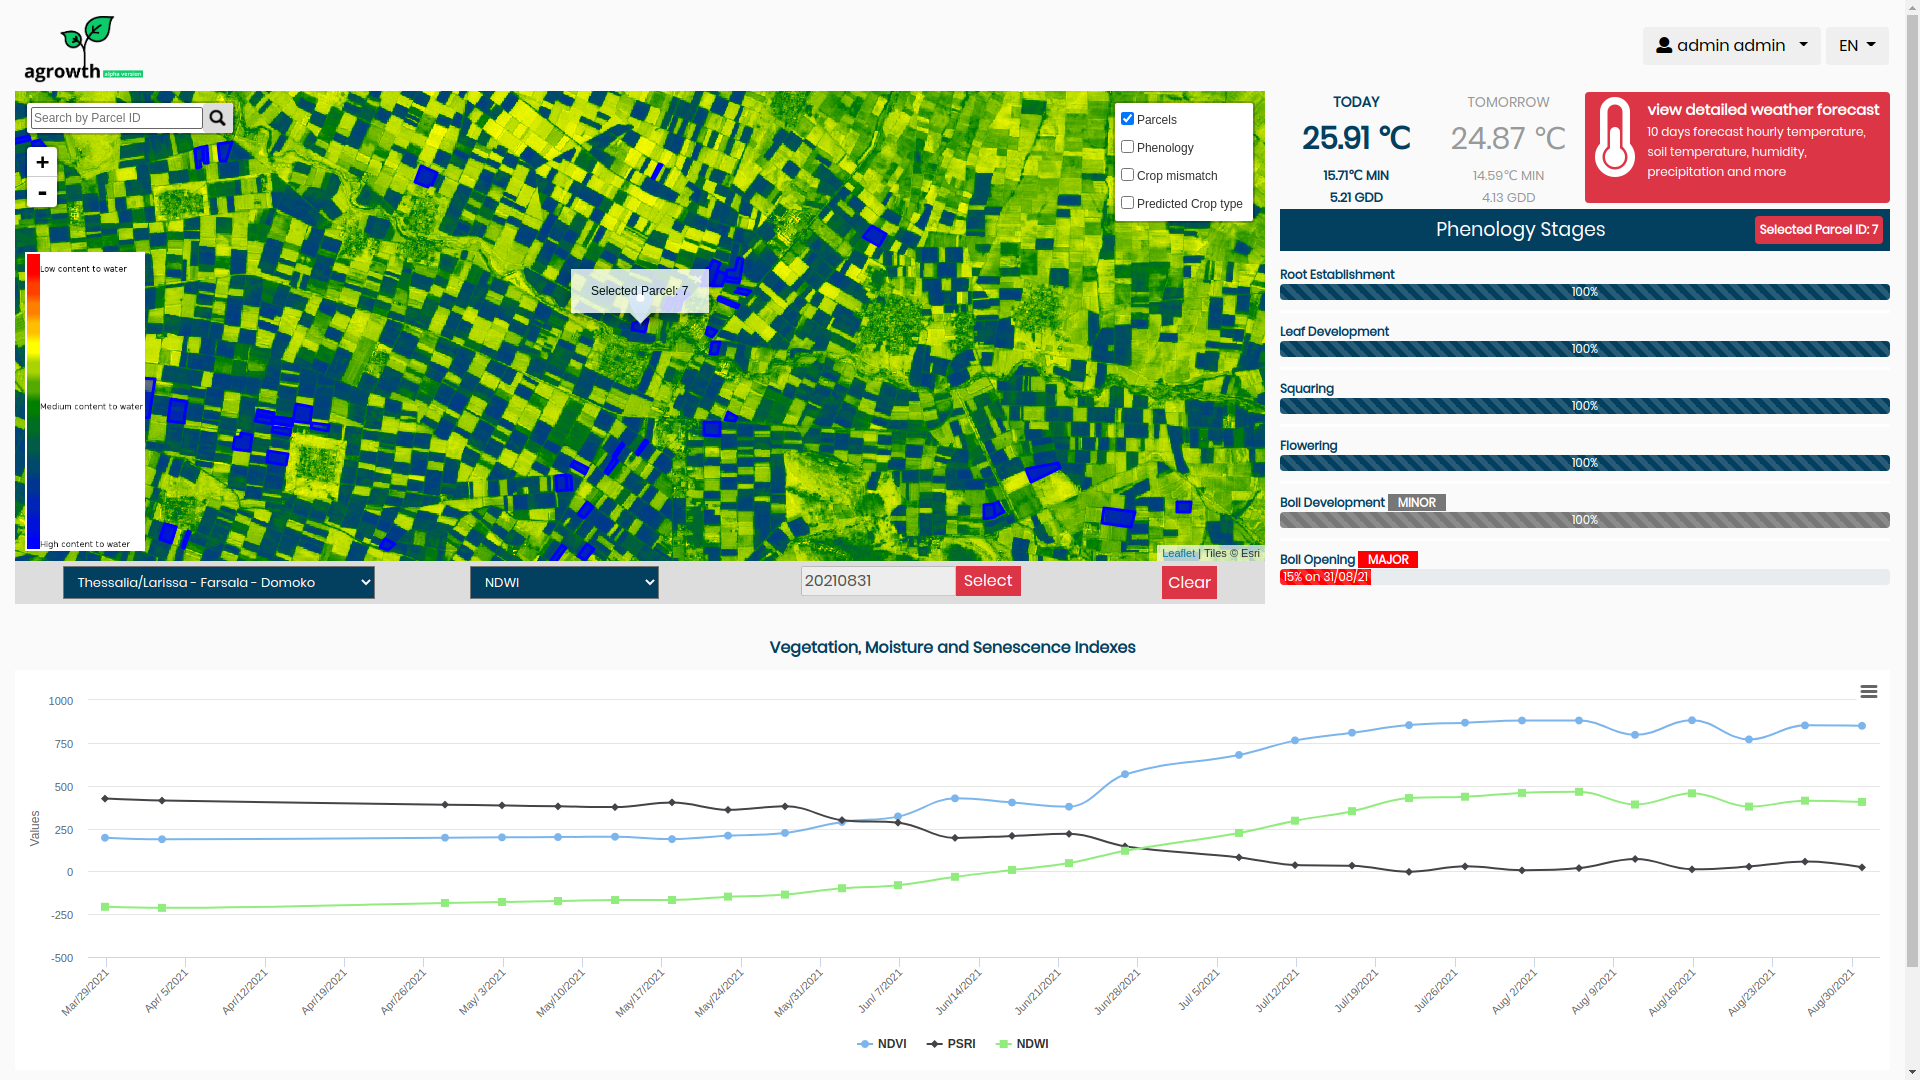
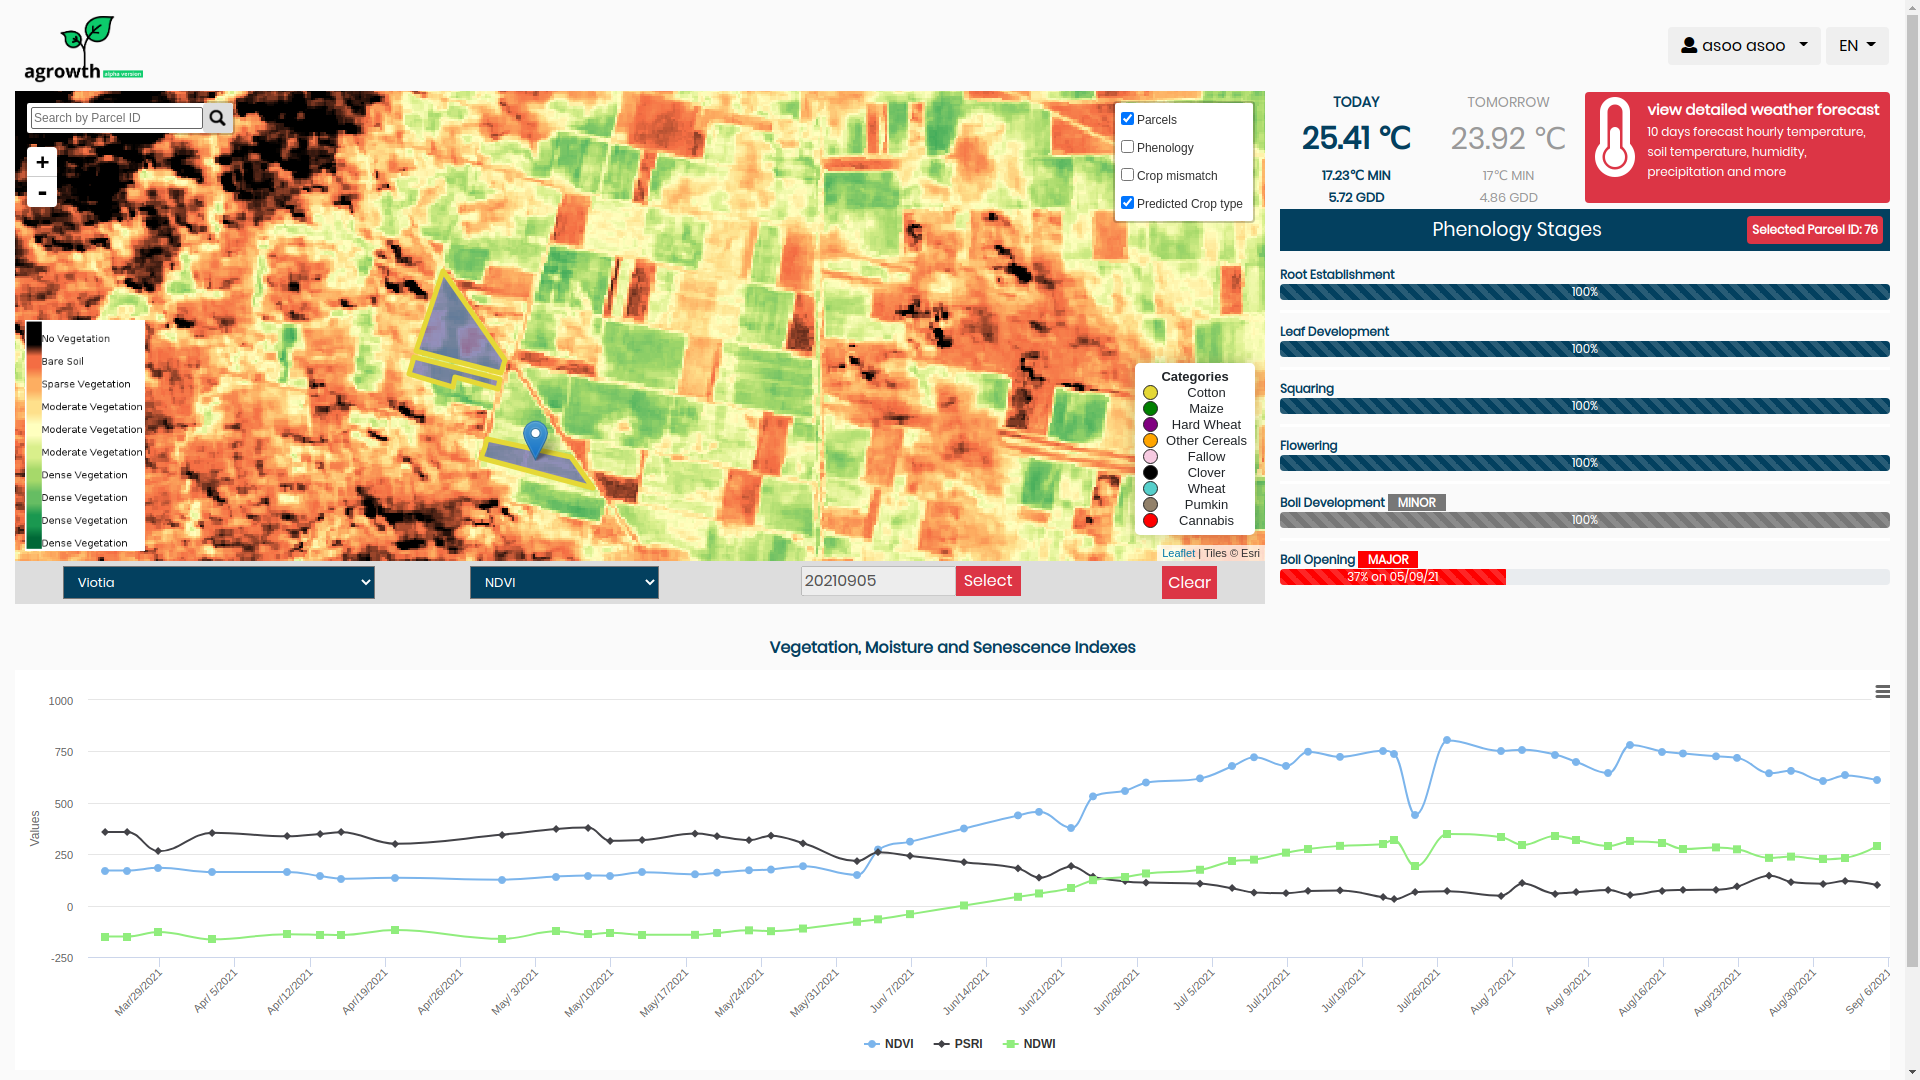
- It estimates the current phenology stage of crop and the fuzzy transition of them in the course of time. → Producer/Farmer knows every time in what stage his/her crop is and he/she is able to take action.
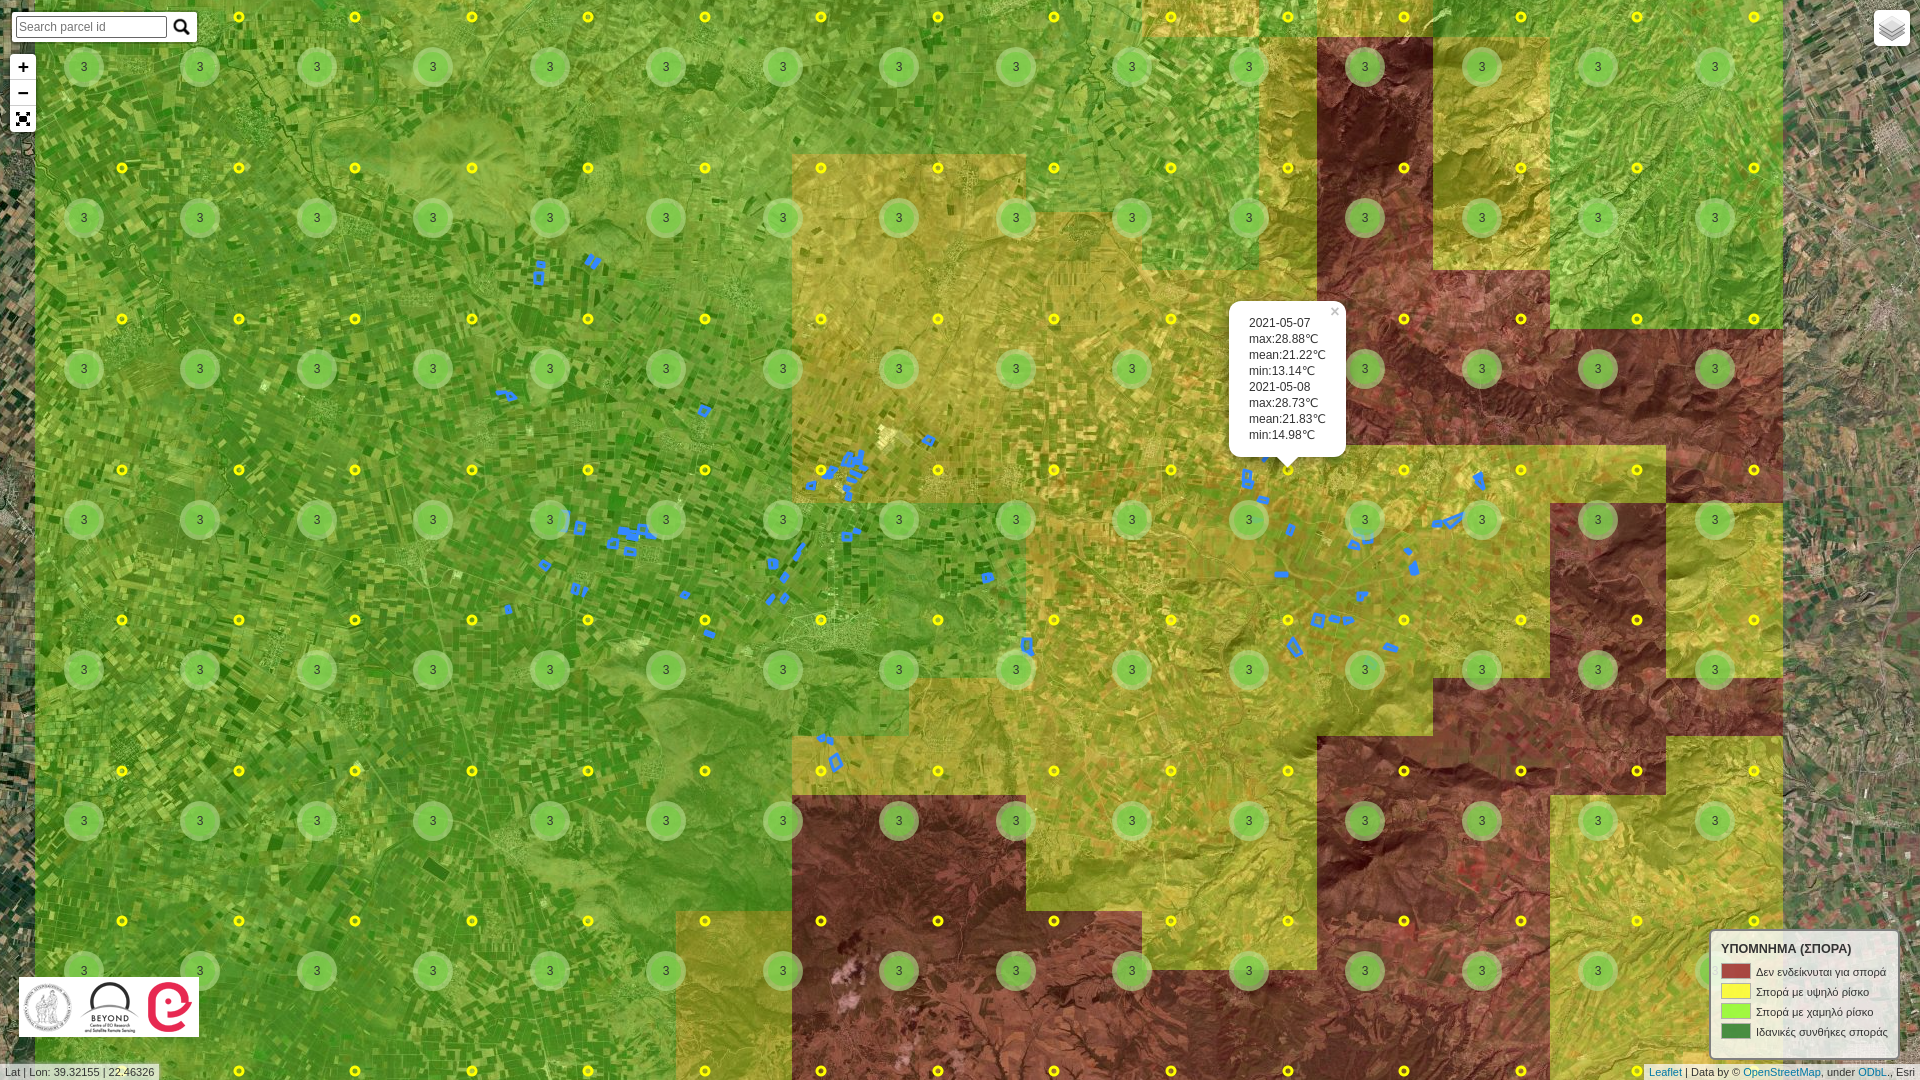
- It provides a heatmap for the sowing period of cotton which estimates daily the risk(high/medium/low) → Producer/Farmer has an indication about the right time of sowing, he/she is able to catch the possible sweet early window of April for cotton sowing.
- It predicts the yield in kg/ha, weeks earlier from the harvest. → Producer/Farmer has a good estimation of yield weeks earlier.
- It provides charts for the evolution of the vegetation indices NDVI, NDWI, PSRI and some crop specific indices. → Producer/Farmer has a good indication in order to monitor the vegetation health and the moisture of the crop.
- It visualizes the max and min ambient temperatures per parcel and it interplays with risk.resagri.eu. → Producer/Farmer has access to ResAgri’s detailed weather information in a 2km x 2km spatial resolution.


Learn more about the service: http://agrowth.beyond-eocenter.eu/
Learn more about e-shape: www.e-shape.eu
A question? Contact the Helpdesk: https://helpdesk.e-shape.eu
This page has no comments.