Terrain Evaluation A seismic survey location is selected to examine the prospects for hydrocarbon resources in the subsurface. Thus, the survey planners have to cope with the geography and topography and their inherent challenges to find the best specific locations to put the source and receivers.
In a heavily forested area, vibrators and other vehicles have limited access. The same can be true of swampy or marshy ground. In desert climates, loose sand dunes create limited access to vibrators. Steep slopes also prevent access for vehicles. Other geographic features present their own logistical problems, which can be detected using combinations of remote sensing methods.
Getting the vibrators and personnel on site is only part of the preplanning required. The topography can also impact the quality of the coupling between source and earth, between receivers and earth, and for signal traversal in the near surface. A rough or rocky surface can lead to point loading of the baseplate, which highly distorts the transmitted signal. This topography can also cause poor coupling of the earth to the receivers. Good coupling can be achieved in soft sediments, as long as the ground can support the baseplate load. However, if the baseplate breaks through the ground, the signal is again distorted, and the high-frequency component can be cut off.
The most significant contribution to surface-related noise in seismic acquisition is ground roll, which is a Rayleigh wave that travels at the ground-air interface. Rayleigh waves travel more slowly than the compressional or shear body waves that travel through the subsurface rock formations; these body waves are the desired signals for seismic surveying of the subsurface. The surface Rayleigh waves also attenuate more slowly than the body waves. In a wet environment such as swamps, marshes and sabkhas, the surface wave includes coupling with the liquid, and this is termed a mud wave. Mud waves are often much slower than a Rayleigh wave because of the weak particle coupling in the water-saturated solid near the surface.
Changes in elevation require static corrections to the seismic signals. This can be particularly difficult in the near-surface, weathered soils. The surface materials may have radically slower velocities than the hard rock beneath. If the weathered layer has significant localized variations in thickness, this can mean a need for static corrections that change rapidly, both vertically and laterally, within a small area. Sand dunes, sabkhas and marshes pose this problem for seismic acquisition.
In sand dunes, the body waves can reflect from the bottom of the dune, becoming a trapped wave within the dune itself. In wadis, the top of the water table affects the first breaks, so its level is important to discern. Soft materials, such as unconsolidated sand, sabkhas or dry glacial till, also display high attenuation of the signal within the surface layer.
Boundaries can scatter the seismic energy, creating noise. This can be a topographic change, such as an escarpment, or a lithological or a mineralization boundary. The risk of noise from scattering is higher in hard ground such as carbonates and basalt. Resonance of seismic waves can occur in areas that are enclosed by a material of different acoustic impedance. For example, once a surface Rayleigh wave from hard rock enters a softer clay pan it can become trapped, reflecting back at another boundary with the hard rock. Similar observations are often made in swamps.
A satellite survey analyzed before deploying a land seismic party can map risks to the survey by discriminating surface features in detail. For example, a DEM is particularly useful in identifying structure in the scale of 10 m and larger. It can locate escarpments and highlight other features that have a common elevation signature, either flat (such as clay pans, sabkhas, floodplains, swamps and marshes) or varied (such as wadis, sand dunes and glacial moraine). At a smaller scale of centimeters to decimeters, radar imagery illuminates surface microstructure or texture information by distinguishing diffuse and specular reflections. This provides information about rock structure, fractures and ripples. In addition, different mineral types have quite different responses in the infrared, so those bands are included in studies of lithology or changes in lithology.
In most cases, the remote sensing analysis incorporates information from one or more satellites, from ground observations and maps including infrastructure, and when available, from subsurface geology. This makes careful integration using a geographical information system (GIS) critical. Within the GIS process, all of the data are brought into a common 3D workspace. Then, for example, an image from a radar satellite can be overlain with a combination of visible and infrared bands, with the traverse and observations of a ground survey mapped in a common space. The GIS software can also allow the viewer to look at the combined data from any angle or to "fly" through the space. By combining the sensed data with physical models, such as wave propagation and source and receiver coupling to various surface materials, and with logical rules, such as safe slope angle for vehicles, the GIS system can display risk information in an easy-to-understand format. This is best seen by example in the case studies that follow.
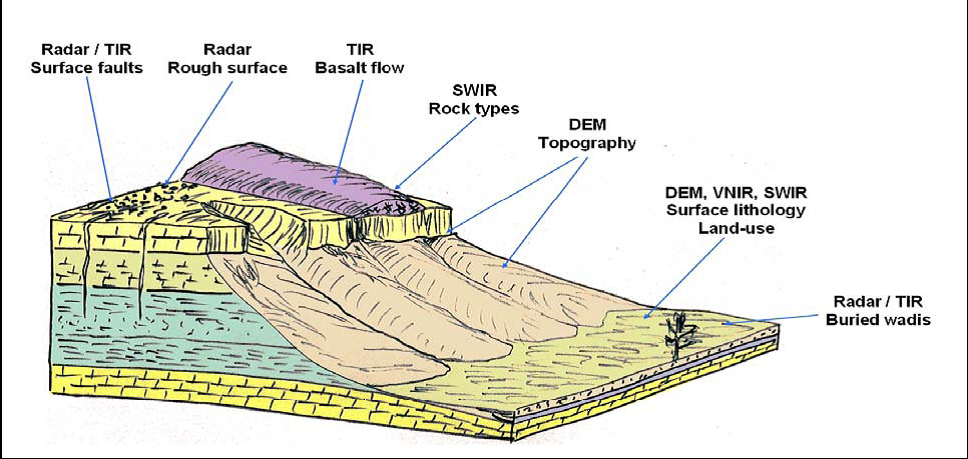
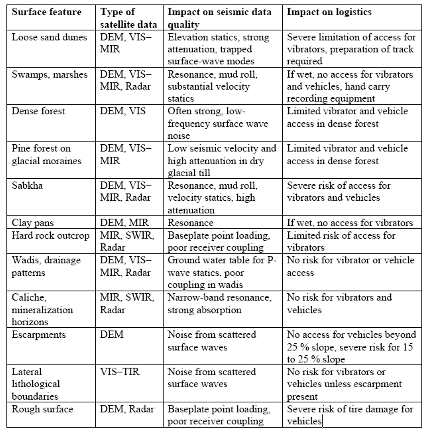
Impact of surface features on seismic survey logistics and data quality. Surface features often encountered in land seismic surveys can be discriminated using combinations of spectral bands (table, below). An example from a desert environment illustrates some of these features (sketch, above).
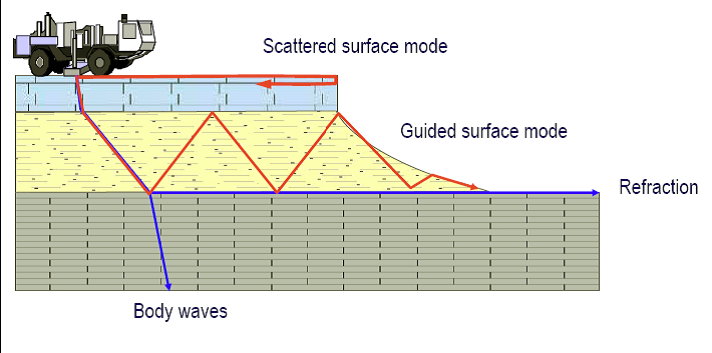
Surface modes in seismic acquisition. Seismic energy from a vibrator truck is directed to deep formations as body waves. However, significant energy is scattered or trapped near the surface. Rayleigh waves travel along the surface and can scatter from escarpments or at changes in lithology. Other seismic energy can be trapped in soft sediments between harder layers, or can be refracted at the interface.
A seismic survey location is selected to examine the prospects for hydrocarbon resources in the subsurface. Thus, the survey planners have to cope with the geography and topography and their inherent challenges to find the best specific locations to put the source and receivers.
In a heavily forested area, vibrators and other vehicles have limited access. The same can be true of swampy or marshy ground. In desert climates, loose sand dunes create limited access to vibrators. Steep slopes also prevent access for vehicles. Other geographic features present their own logistical problems, which can be detected using combinations of remote sensing methods.
Getting the vibrators and personnel on site is only part of the preplanning required. The topography can also impact the quality of the coupling between source and earth, between receivers and earth, and for signal traversal in the near surface. A rough or rocky surface can lead to point loading of the baseplate, which highly distorts the transmitted signal. This topography can also cause poor coupling of the earth to the receivers. Good coupling can be achieved in soft sediments, as long as the ground can support the baseplate load. However, if the baseplate breaks through the ground, the signal is again distorted, and the high-frequency component can be cut off.
The most significant contribution to surface-related noise in seismic acquisition is ground roll, which is a Rayleigh wave that travels at the ground-air interface. Rayleigh waves travel more slowly than the compressional or shear body waves that travel through the subsurface rock formations; these body waves are the desired signals for seismic surveying of the subsurface. The surface Rayleigh waves also attenuate more slowly than the body waves. In a wet environment such as swamps, marshes and sabkhas, the surface wave includes coupling with the liquid, and this is termed a mud wave. Mud waves are often much slower than a Rayleigh wave because of the weak particle coupling in the water-saturated solid near the surface.
Changes in elevation require static corrections to the seismic signals. This can be particularly difficult in the near-surface, weathered soils. The surface materials may have radically slower velocities than the hard rock beneath. If the weathered layer has significant localized variations in thickness, this can mean a need for static corrections that change rapidly, both vertically and laterally, within a small area. Sand dunes, sabkhas and marshes pose this problem for seismic acquisition.
In sand dunes, the body waves can reflect from the bottom of the dune, becoming a trapped wave within the dune itself. In wadis, the top of the water table affects the first breaks, so its level is important to discern. Soft materials, such as unconsolidated sand, sabkhas or dry glacial till, also display high attenuation of the signal within the surface layer.
Boundaries can scatter the seismic energy, creating noise. This can be a topographic change, such as an escarpment, or a lithological or a mineralization boundary. The risk of noise from scattering is higher in hard ground such as carbonates and basalt. Resonance of seismic waves can occur in areas that are enclosed by a material of different acoustic impedance. For example, once a surface Rayleigh wave from hard rock enters a softer clay pan it can become trapped, reflecting back at another boundary with the hard rock. Similar observations are often made in swamps.
A satellite survey analyzed before deploying a land seismic party can map risks to the survey by discriminating surface features in detail. For example, a DEM is particularly useful in identifying structure in the scale of 10 m and larger. It can locate escarpments and highlight other features that have a common elevation signature, either flat (such as clay pans, sabkhas, floodplains, swamps and marshes) or varied (such as wadis, sand dunes and glacial moraine). At a smaller scale of centimeters to decimeters, radar imagery illuminates surface microstructure or texture information by distinguishing diffuse and specular reflections. This provides information about rock structure, fractures and ripples. In addition, different mineral types have quite different responses in the infrared, so those bands are included in studies of lithology or changes in lithology.
In most cases, the remote sensing analysis incorporates information from one or more satellites, from ground observations and maps including infrastructure, and when available, from subsurface geology. This makes careful integration using a geographical information system (GIS) critical. Within the GIS process, all of the data are brought into a common 3D workspace. Then, for example, an image from a radar satellite can be overlain with a combination of visible and infrared bands, with the traverse and observations of a ground survey mapped in a common space. The GIS software can also allow the viewer to look at the combined data from any angle or to "fly" through the space. By combining the sensed data with physical models, such as wave propagation and source and receiver coupling to various surface materials, and with logical rules, such as safe slope angle for vehicles, the GIS system can display risk information in an easy-to-understand format. This is best seen by example in the case studies that follow.
Impact of surface features on seismic survey logistics and data quality. Surface features often encountered in land seismic surveys can be discriminated using combinations of spectral bands (table, below). An example from a desert environment illustrates some of these features (sketch, above).
Surface modes in seismic acquisition. Seismic energy from a vibrator truck is directed to deep formations as body waves. However, significant energy is scattered or trapped near the surface. Rayleigh waves travel along the surface and can scatter from escarpments or at changes in lithology. Other seismic energy can be trapped in soft sediments between harder layers, or can be refracted at the interface.
[1|#_ftnref1] The mud wave is also termed a Stoneley-Scholte wave, or just a Scholte wave.
This page has no comments.