Reservoir mapping in the Gulf of Suez is challenging due to rifting which has broken up the reservoirs through transform and cross faults. Identification of geological features from Earth Observation (EO) data can give an early and reasonable indication of likely reservoir locations. These are more easily seen in clear or deserted regions, but areas of forested / agricultural land where the surface is covered or artificially modified are not as suitable for surface geological modelling. Multispectral satellite data (landsat 7 ETM) used in combination with elevation mapping from a Digital Elevation Model (DEM) dataset was used in this study.
A seismic survey conducted by WesternGeco in this area in Egypt found that the surface wave data had a high correlation with the EO data at the surface. Using reservoir modelling software Petrel (1) these data sets have been combined and interpreted for shallow drilling risk related to fault outcrops.
(1) Petrel is a Schlumberger software
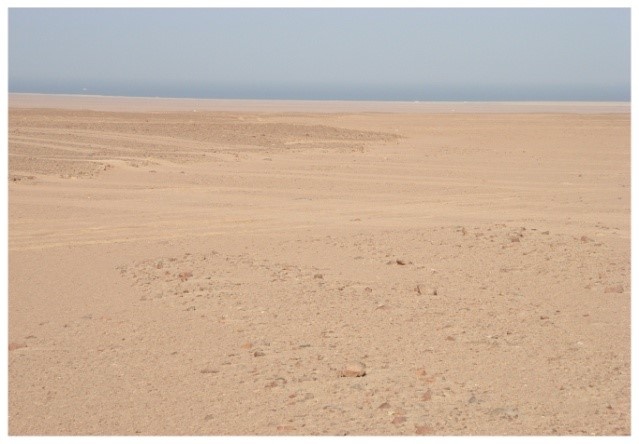
This case study is located in an exploration concession in Egypt between the Gulf of Suez and the Red Sea Mountains (figure1). Standing on the surface of the survey area (left) there are no obvious signs of the geological complexity beneath. In the subsurface it was anticipated that the effects of the rift faulting would be seen. EO data is used to look for patterns that can predict geological faulting. This work was undertaken during the start of the exploration phase and was followed by a high resolution 3D seismic survey. Surface wave data from the seismic survey was processed and shown in geological modelling software to complement the EO derived data sets. Further information is available in the paper published in petroleum geoscience (1).
Fault mapping is important (and normally undertaken) because it provides an early indication of likely reservoir locations. Typically, fault mapping will occur in areas which are not vegetated and have rocks outcropping on the surface. However in this case study using EO data provided, valuable datasets in mapping the waadi courses and the cross faulting trends, no rock was exposed at the surface. By identifying the faults using EO data and validating it through high resolution point receiver seismic data, drilling risk can be reduced. One of the drilling risks would be that faults and fractures that the wellbore encounters open conduits for loss of drilling fluid to the formation (2).
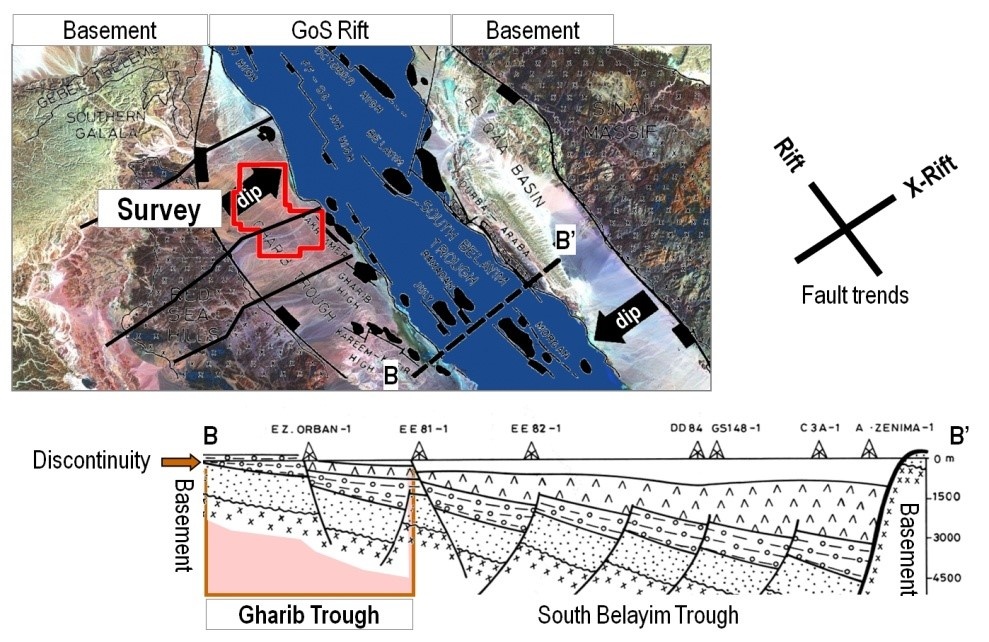
Figure 1: Case study location
The goal is to create a series of maps that highlight the surface geology and help identify lineaments. To generate these maps the following information is required
- Topographic information
- Terrain information
- Lithology, geology and structural properties of the surface
The SRTM DEM provides the input to the elevation and slope mapping. In this particular example the surface is relatively flat so the 90m resolution elevation model had minimal use, however it did confirm the slight dip that runs inland towards the Gulf of Suez. Normally in geological surface modelling EO derived elevation datasets help show outcropping and surface faults.
The Landsat 7 ETM satellite captures intensity data from seven spectral bands as well as a panchromatic band. Three of the bands (1, 2, and 3) are in the visible part of the electromagnetic spectrum covering red, green and blue (RGB). Band 4 is the very near infrared image and this is especially useful to measure the strength and vigour of vegetation. Band 5 and 7 are found in the short wave infrared spectrum (SWIR). These bands are useful to discriminate rock types. Band 6 is the thermal band and provides a measure of the mineralogy as rocks radiate heat at different intensities. It is through a combination of RGB composite images and map algebra (for example band ratio 4/5 is a measure of clay content) that surface geological models can be built.
The true colour image in figure 2a shows the main wadi courses. Whereas the inverse of this image highlights the structure of the wadi courses (see figure 2b). An RGB composite image of the difference between 675 (thermal and short-wave infrared) and 321 (true colour) has been found to be the optimal way to highlight the lithology (figure 2c). The image shows red corresponding with a high content of quartz sand, green highlighting coastal salt flats and blue indicative of basement plutonites and weathered sand. Figure 2d highlights the wadi courses, this image is an enhanced ratio of thermal and panchromatic bands. The contrast in the image is high due to the wadi, which has a higher moisture content thus correlating to a lower thermal response compared to the panchromatic band.
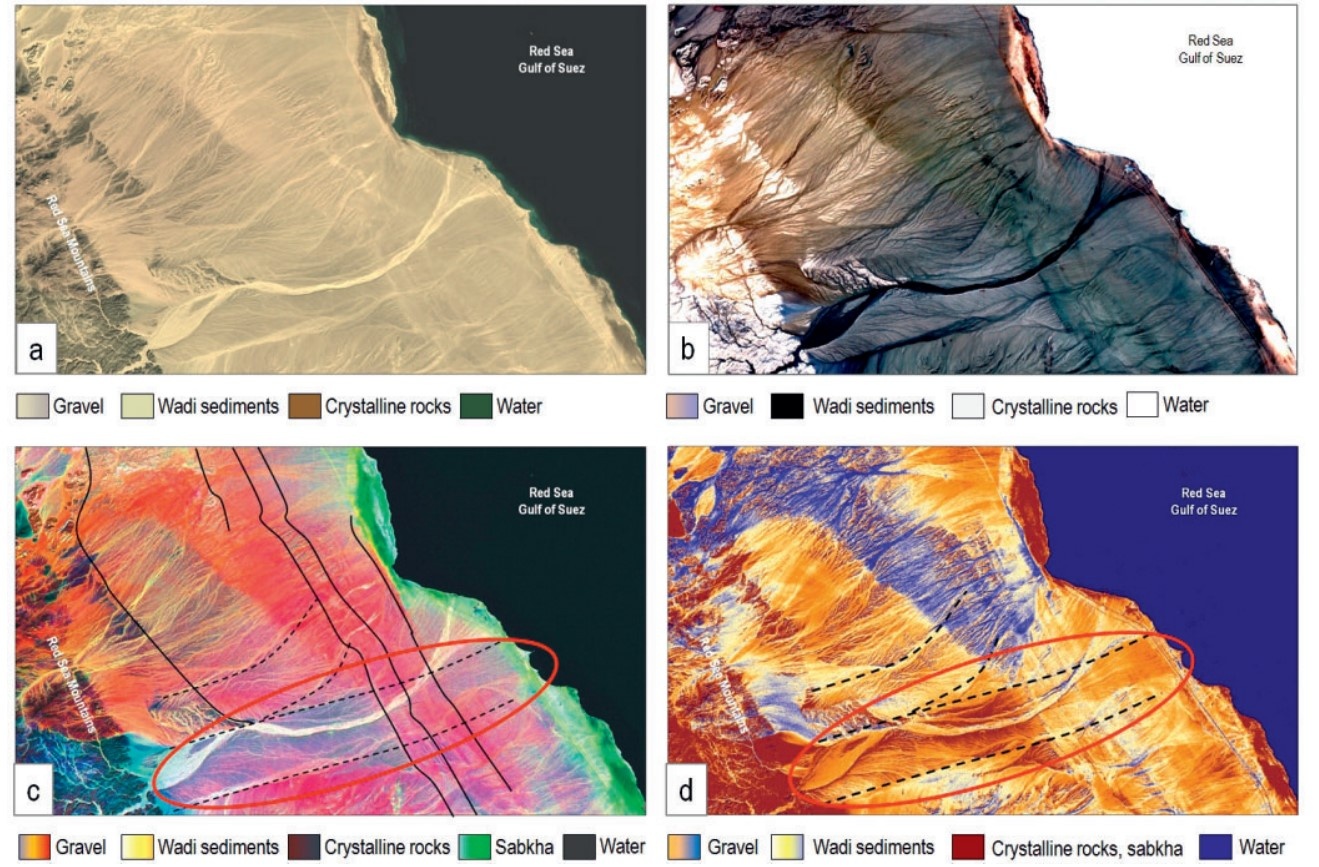
Figure 2: Satellite image processing for structural geology: a – conventional Landsat 321 RGB, b – inverted Landsat 321 RGB, c - high discrimination lithology image, d – wadi map
Through the combination of the images shown in figure 2, produced from Landsat 7 ETM bands, structural elements such as the box structure (red circle), rift parallel clysmic faults (continuous lines) and cross-rift faults (dashed lines) are revealed. Image processing on the wadi courses can produce a wadi map which plots details of the wadi courses. Braided stream sections occur on the steeper slopes and fan deltas are found close to the coast.
In frontier areas the use of satellite imagery can be used to prioritise areas likely to contain oil and gas prospects. There are restrictions with heavily vegetated regions where surface geology is difficult to model with EO data. However in arid and semi-arid regions of the world, high discrimination lithology mapping, as shown in this case study, can reveal structural elements from the subsurface. It is through a combination of data, of which EO is one, that reservoir modelling can be improved and aid the exploration of the reservoir.
This case study began prior to the start of a seismic survey. EO derived products have been shown to produce geological surface models and provide hints to the subsurface structure. The use of GIS software has allowed many EO datasets to be integrated with point-receiver seismic data. By using data in archives means that a relatively fast turnaround time can be achieved.
This project finished when the seismic data cube was loaded into Petrel (1). The seismic data provides high-resolution broadband Rayleigh wave and short-offset refraction data. This can then be used to connect the fault outcrops at the surface with the structural framework at the reservoir.
(1) Petrel is a Schlumberger software
Contact
Andrew Cutts – Senior GIS Engineer WesternGeco. acutts@slb.com
This page has no comments.