Multispectral satellite imagery, from Landsat 7 ETM, high resolution archive Quickbird data and a Digital Elevation Model (DEM) from the space shuttle radar topographic mission (SRTM) were used to map soft ground in UAE. This Earth Observation (EO) data was used in combination with field scouting to plan for areas susceptible to sabkha and to mitigate against risks such as vehicle sinking in.
A land seismic survey conducted by WesternGeco in Western UAE, near the town of Sila, found large areas of soft ground unsuitable for vibroseis operations. Soft ground reduces the accuracy of seismic output and delays operations by slowing vehicles. In areas dominated by sabkha vibroseis sources may need to be replaced with explosive sources.
Satellite data was used extensively during this project providing an important input into the operating plans of the crew.
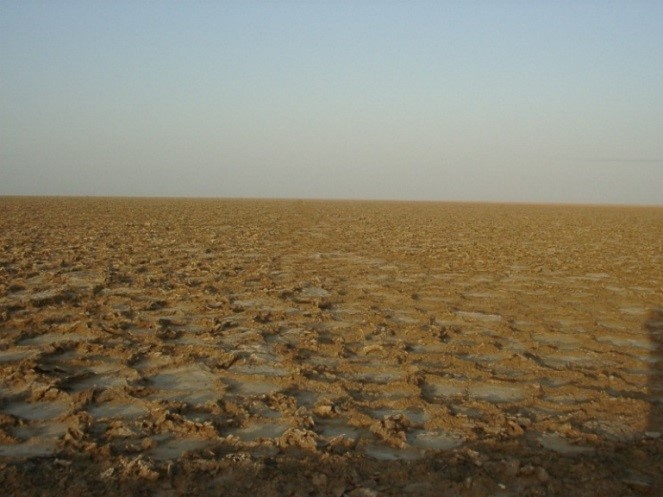
Sabkha (pictured left) is Arabic describing a relatively flat saline area of sand or silt that typically forms above the water table. Sabkha tends to be found in coastal regions or inland topographic lows. These areas tend to be deceptive, the surface will appear hard due to the saline crust, however, immediately below only a consolidated mixture of evaporate minerals and salt brine exists.
The Eastern Arabian Peninsula is especially susceptible to sabkha, in particular the stretch of coast from Abu Dhabi to Sila in the west of the UAE.
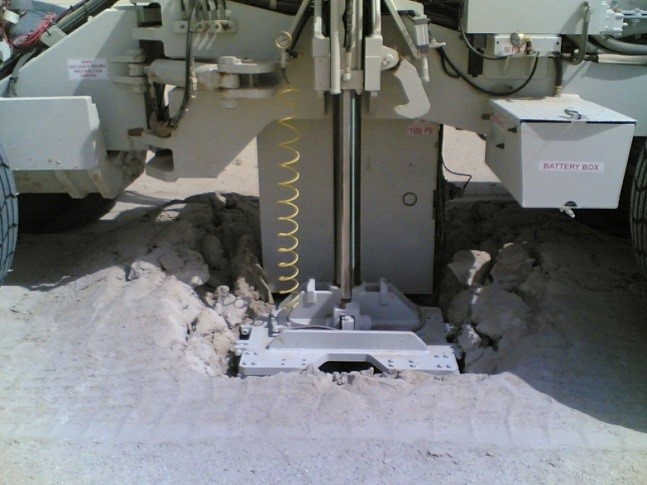
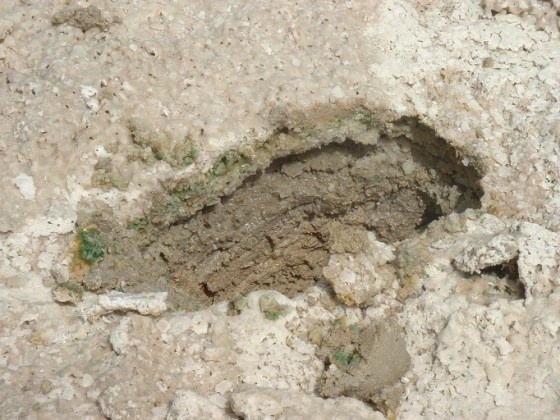
The danger for vibroseis operations is that the baseplate may break through the surface (right), or worse the vehicle will become buried by the soil. Early detection of sabkha is critical for survey design; ensuring that the operation is as safe as possible and helping to understand the requirement for other types of sources (explosives or mud gun). The aim is to map areas which are not suited for vibroseis operations, validate in the field and plan the most efficient survey.
When vibroseis trucks began to get stuck, after lighter scouting vehicles had successfully travelled across the surface, EO data was used to look for patterns and to map future hazardous areas. It is important that EO is not solely relied upon to generate soft ground maps but used in conjunction with field visits. Due to the immediacy of this project archive Landsat 7 ETM data provided the fastest access to EO data
The goal is to generate a soft ground risk map. To generate this map the following information is required:
- Topographic information
- Terrain information
- Lithology, geology and structural properties of the surface
The topographic information from the SRTM DEM provides the input to elevation and slope mapping. The terrain, lithology, geology and structural properties are provided by Landsat 7 ETM. Quickbird data (2006) were used to complement the multispectral images. All EO datasets were clipped to a common area of interest.
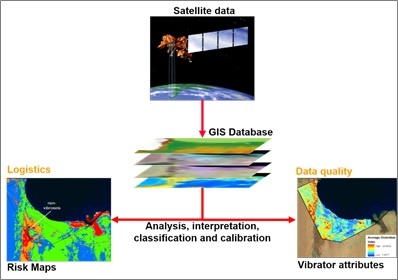
The Landsat 7 ETM data were merged to create RGB composite images with different band combinations used to highlight different aspects of the surface. The data is stored in a GIS database (summarised in the diagram above). Utilizing previous studies and gaining knowledge of the area will significantly improve the results. Studying the DEM reveals some slight variations in the topography; inland depressions could mean the occurrence of sabkha, where water could pool (Figure 1).
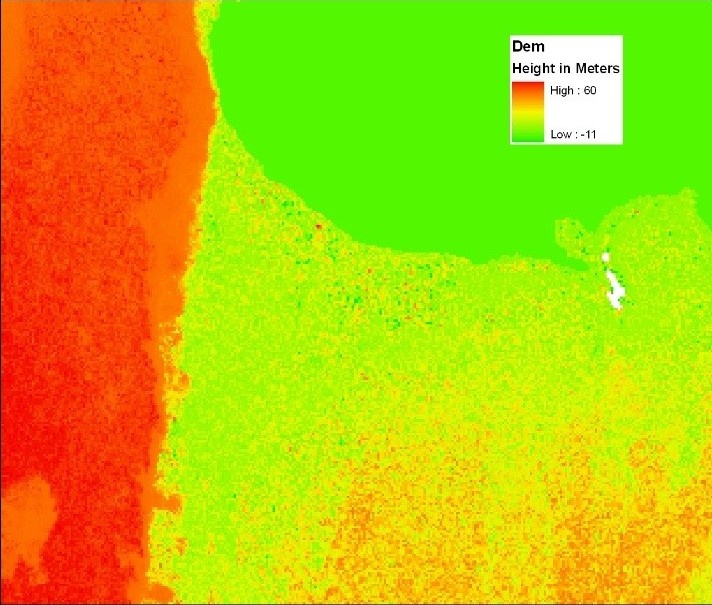
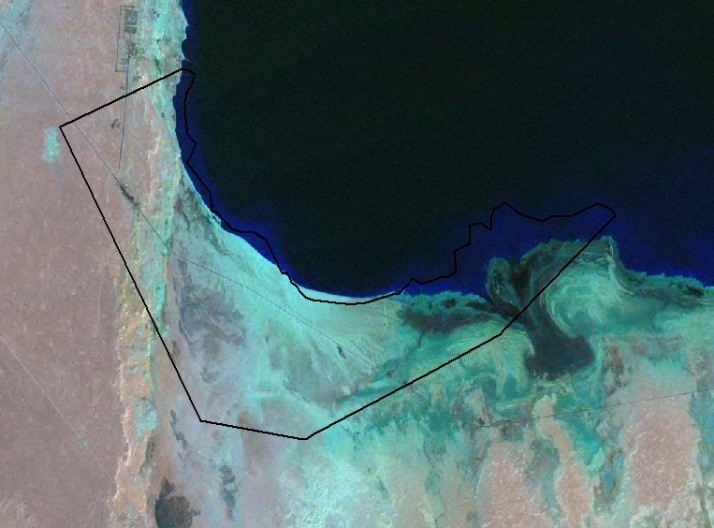
Figure 1: DEM (left) and Landsat 742 RGB (right) for the study area
The findings from the EO data were calibrated with surface geological probing at selected locations with focus on the edge of the sabkha. Mineralogical indicators (right), like the presence of discoidal gypsum, were used to identify a water table close to the surface. The occurrence of discoidal gypsum may be related to the locations where sabkha is thought to exist.
Field verified points are correlated with the Landsat 7 ETM data and a supervised classification forms the basis for the sabkha risk maps. Plotting the locations where vibrator trucks got stuck and interpolating the vibrator sweep performance data to a raster image, such as distortion data, allows us to overlay this information in aGIS.The findings from the remote sensing and surface geological data are calibrated. The correlation between the sabkha risk map (left) and the vibrator total harmonic distortion (THD) attribute map (right) is shown in Figure 2.
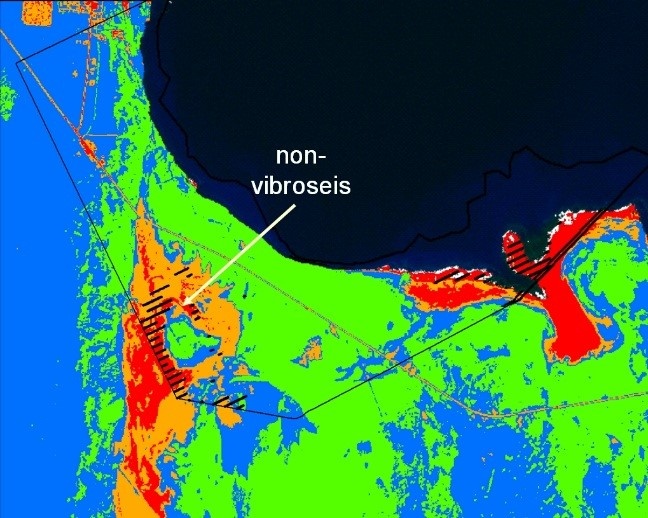
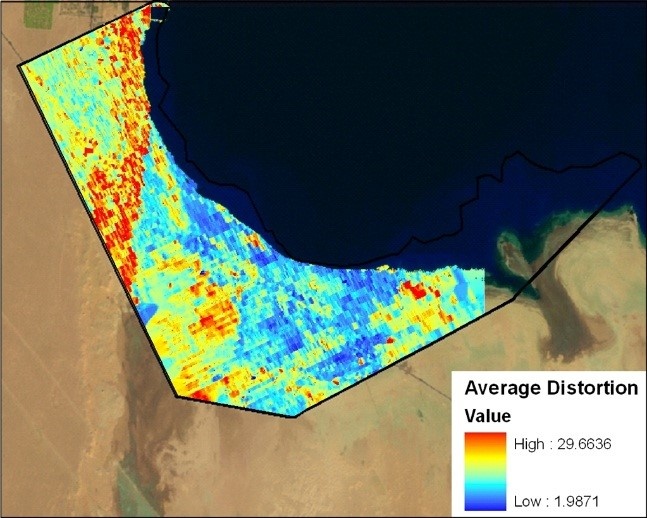
Figure 2: Sabkha risk map from unsupervised classification of Landsat satellite data (left), Vibrator distortion map (right)
The comparison of multispectral Landsat data with known field measurements, such as known locations of sabkha and geotagged images, makes it possible to identify areas of sabkha. Analysis of all bands showed the clarity in a combination of thermal infrared, short-wave infrared and visible data, which enabled the best multiband image to be created. Anything appearing in red or orange in the sabkha risk map (figure 2 left) has a high or medium risk of sabkha.
The impact on the data quality is obtained from vibrator QC attributes such as total harmonic distortion. The gridded QC attributes are displayed as a map, which is correlated with the risk map obtained from remote sensing. High distortion is correlated with the areas of high sabkha risk. Hence, the impact of sabkha on vibroseis operation is on both logistics and data quality. This suggests that we might select a different energy source for wet sabkha source points that cannot be accessed by vibrators.
A soft ground risk map created with EO data provides a seismic crew with an invaluable dataset in which to plan and successfully execute a safe survey. Desert crusts that have been identified during field scouting can appear to support the weight of seismic vehicles, but ultimately once broken through they will sink fast. Unfortunately field scouting cannot visit all the pre-planned shot points. EO data mitigates this problem by helping drive the scout to locations that could be a soft ground risk. Once a seismic vehicle has broken through the crust and has become stuck these known soft ground points can be correlated with the EO data to produce a detailed map of high risk areas. Ideally the soft ground will be accurately modelled prior to the start of the project using EO data, however it is through continuous modelling that actively promotes the safe field operations.
Using a GIS for the capture of geographically referenced remote sensing derived maps and the integration with geo-tagged ground photos enables the calibration with seismic data quality measurements, for example vibrator QC attribute data.
In this study, we have shown that wet coastal sabkha areas are best highlighted in a multiband Landsat classified image using a combination of thermal, shortwave infrared and visible data, especially when supported by digital elevation models. Risk maps generated with the methodology described in this case study can assist the survey planning.
Contact
Andrew Cutts – Senior GIS Engineer WesternGeco. acutts@slb.com
This page has no comments.