Satellite earth observation (EO) data helped to assess and monitor environmental conditions – in particular flooding – during a seismic survey in Peru. By generating a detailed flood assessment map, a flexible approach to the timing and shooting order of a seismic survey could be introduced during the survey planning process. If access to one location was restricted by river flooding, alternative locations could be quickly identified, which facilitated keeping the survey within time and budget.
A seismic survey in the Ucayali region of Peru within the Amazon basin needed to be carried out, in part during the rainy season. While the rainy season (December until May) in the Ucayali region only experiences around 10% more rain on average than the dry season (June to November), it is prone to flash flooding. Increased river discharge can raise water levels as much as 10-12 cm per day. During floods, river levels can easily rise by 5 m in either season. The difference between low and high water can be upwards of 10 m.
Located within a deltaic region inside the Amazon rainforest, the survey area was dominated by tree covered hills. With the survey being conducted in the rainy season it was expected that access to some of the survey locations would temporarily be restricted due to flooding. If possible, the detection of areas liable to river flooding would allow for the development of a more complete and considered survey plan, and avoid costly stand-by rates and time delays (when the acquisition contractor stands down because of encroaching flood waters).
Real-time water level monitoring was in place around the area as the survey progressed. If the seismic contractor encountered flooding in their work location, knowledge of alternative locations that may remain accessible could reduce the down-time associated with the project. A flood extent model could be used to provide such information. The goal of this analysis was to show how a seismic survey could be successfully carried out in the rainy season and so increase the available survey acquisition windows throughout the year.
For accurate flood modelling, the first requirement was a digital terrain model (DTM) that could be used for assessing the local survey environment. Analysis of the DTM defined the flood basins, which were compared against the proposed survey plan. Rivers were derived from the DTM to complete the drainage and floodplain picture.
Multiple DTM options were considered for the survey area; an overview of these can be seen in Table 1. Considering project needs for rapid delivery of a DTM at low cost, Satellite Radar Topography Mission (SRTM) data was chosen. SRTM is freely available at 90 metre resolution.
Table 1 Overview of DTM products.
Product | Sensor Type | Horizontal Resolution | Cost for complete survey coverage | Acquisition Time |
Aerial Survey | Lidar | Decimetre | $1.3 million | On demand. Acquisitions and production time required |
Elevation 8 | InSAR | 8 metre | Approx. $22,000 | On demand for this area. Production time required |
WorldDEM | InSAR | 12 metre | Approx. $13,000 | Off the shelf only partly available for area of interest, or on demand |
SRTM | InSAR | 90 metre | Free | Off the shelf |
The overall activities are:
- Generate elevation profiles for each survey line (from the SRTM DTM);
- Generate flood extent models (from the SRTM DTM);
- Review optical EO data (Landsat-8, Google Earth) to determine suitable river level sampling locations;
- Sample and integrate river level information (from flow gauges);
- Identify potential problem seismic survey points (on low-lying ground near rivers); and
- Identify potential alternative seismic survey locations.
River levels vary locally, requiring that measurements be obtained across the study area to map river levels and changes in levels. While there are existing river gauges along the Ucayali River, they may not always be near to the project area. Finding accessible and safe ground survey locations for river level monitoring was important.
Using the DTM generated from SRTM data it was possible to compile an elevation profile for each survey line. This could then be used to locate survey points that fell on low lying ground close to rivers and therefore identify probable areas of flooding.
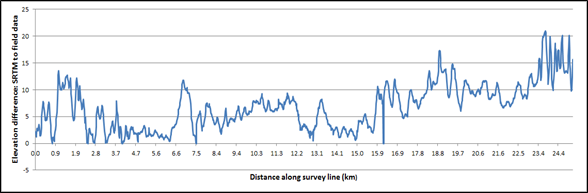
From initial comparisons between field data and EO data, it was apparent that there was an offset between the SRTM derived elevations and the field survey data (Figure 1a) which would affect the flood extent models. SRTM has some relevant known limitations: C-band radar does not have full penetration into forest canopy, and so a true surface model is not returned; and the relatively coarse cell size cannot capture localised elevation differences. Analysis of the field data and SRTM elevations showed an average error of between 5 m and 20 m in regions dominated by canopy cover. In areas of no canopy this error reduced to less than 2 m (Figure 2b to Figure 2d).
Some adjustment for mean SRTM elevation values can be made with reference to field data; however, this may not always be practical. For logistics planning, alternate access to a section of survey line might be preferable, and therefore the ability to estimate ground elevations over a wider area was deemed important.
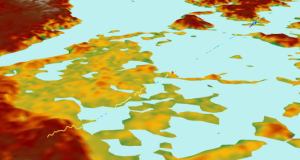
The outputs of the flood extent modelling simulations are provided in Figure 2. These simulations are limited by the accuracy of the underlying DTM, but can show general trends applicable to evaluating alternative seismic survey points along a transect.
Figure 1: SRTM elevations against field survey data.
a) Elevation offset between SRTM data and survey derived values for a seismic line
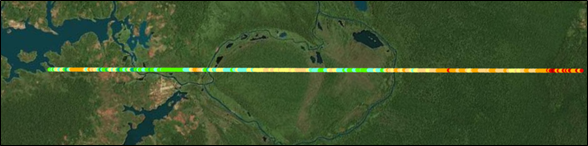
b) Seismic line elevation differences colour coded (m) overlaid on a Landsat image

c) Wider area seismic lines with elevation differences colour coded (m)
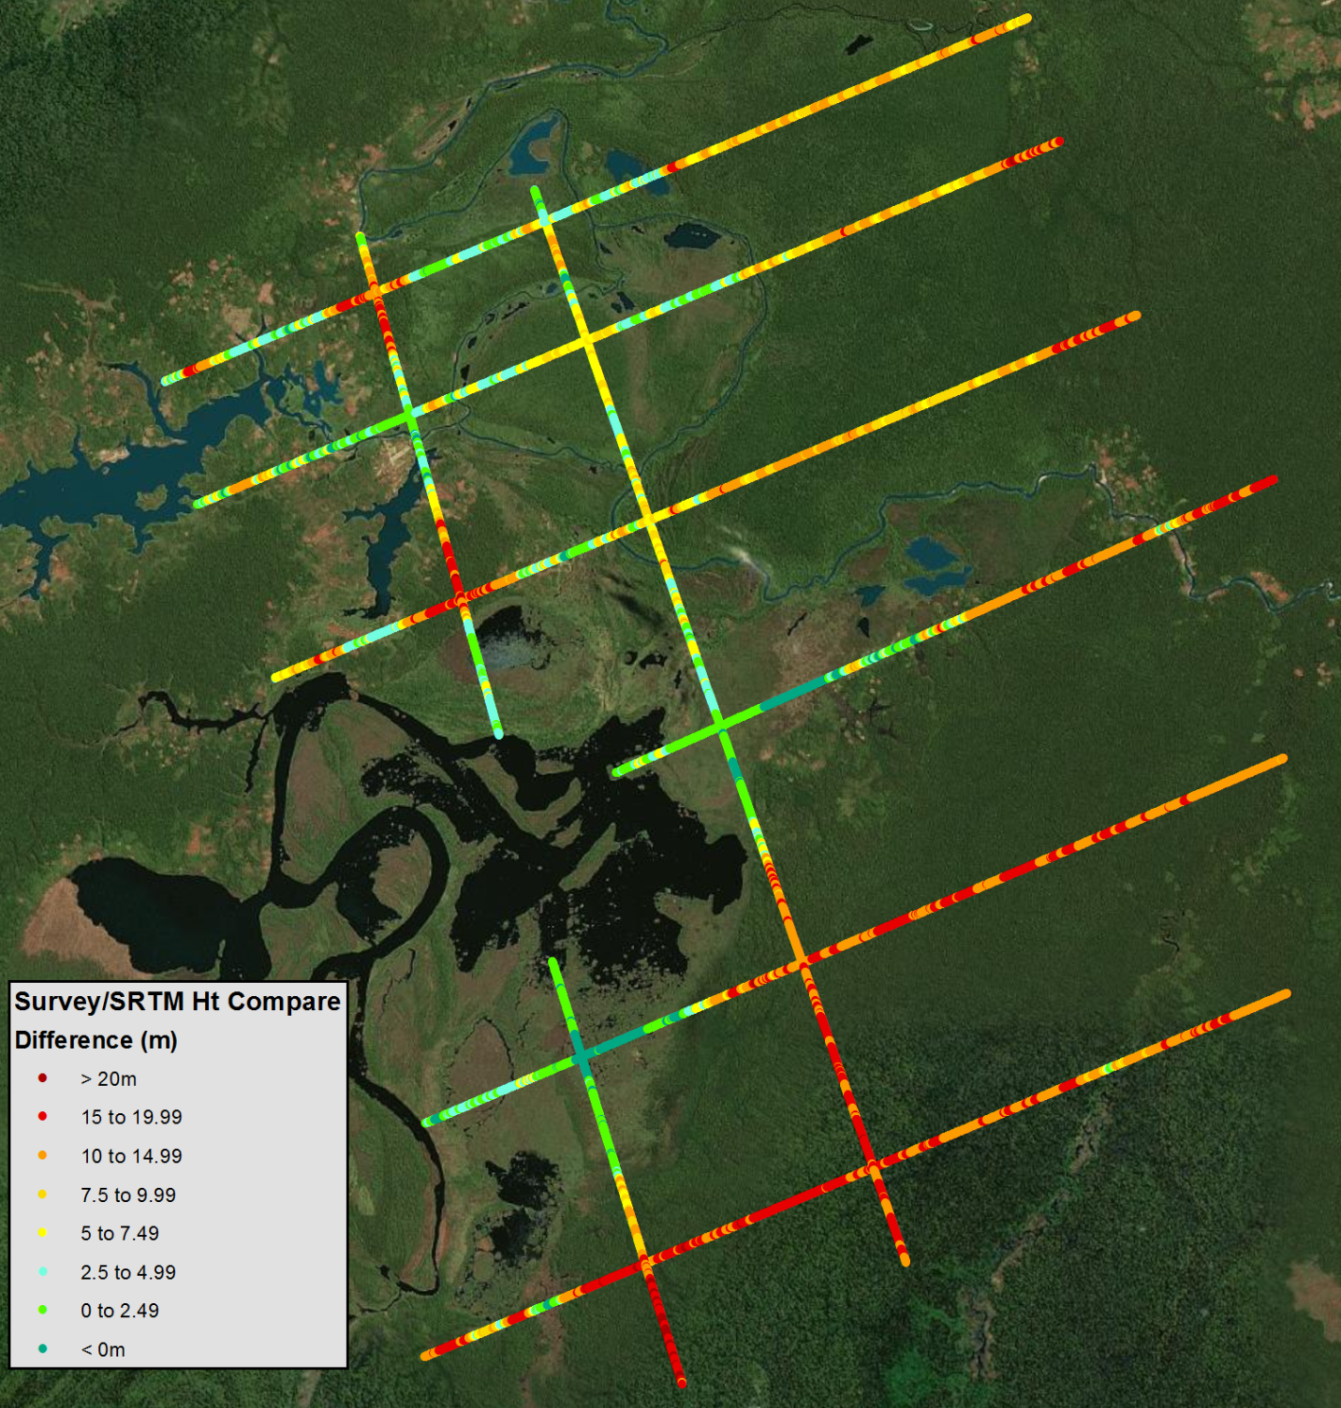
d) Highlighting sections of seismic lines with SRTM elevations affected by tree canopy
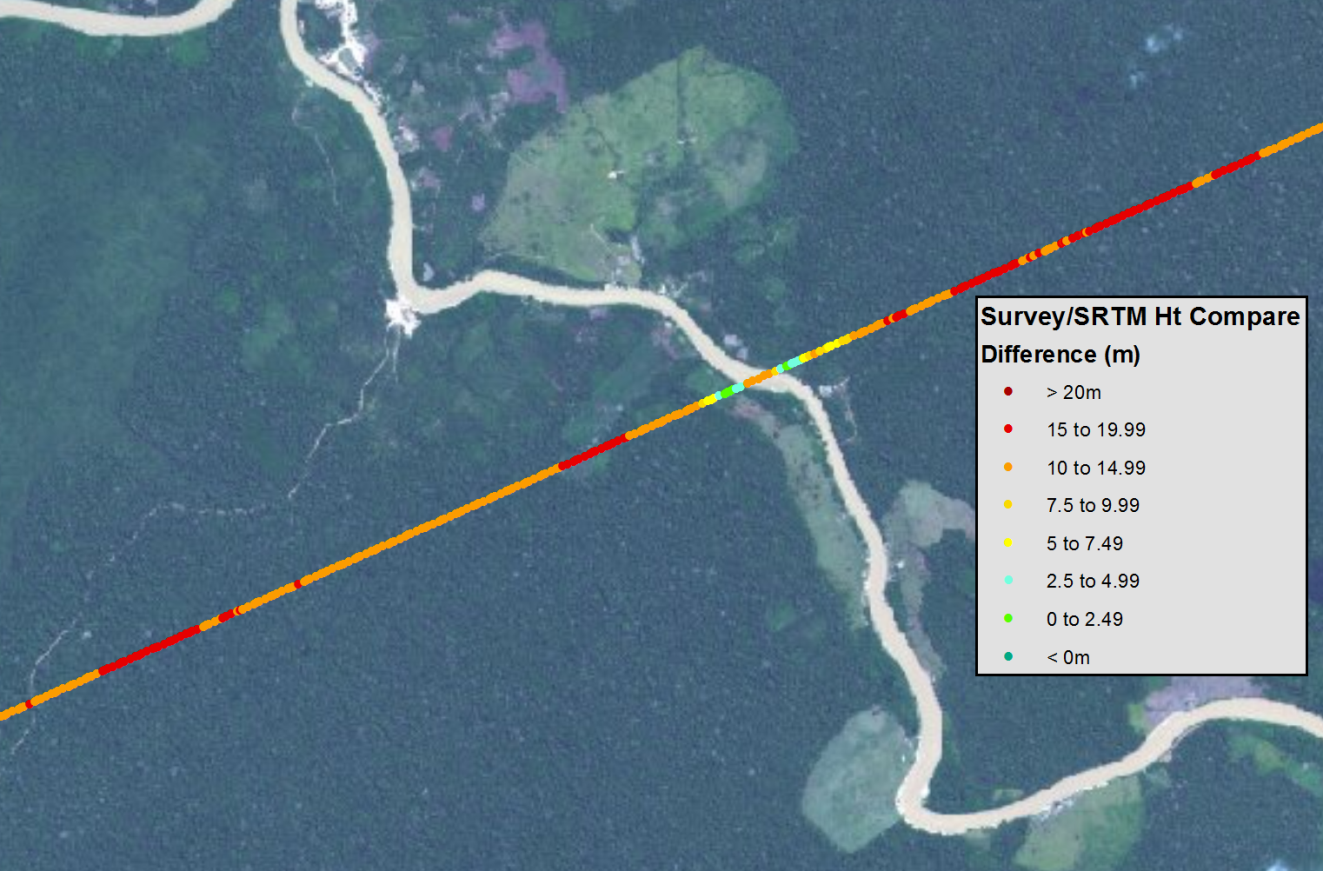
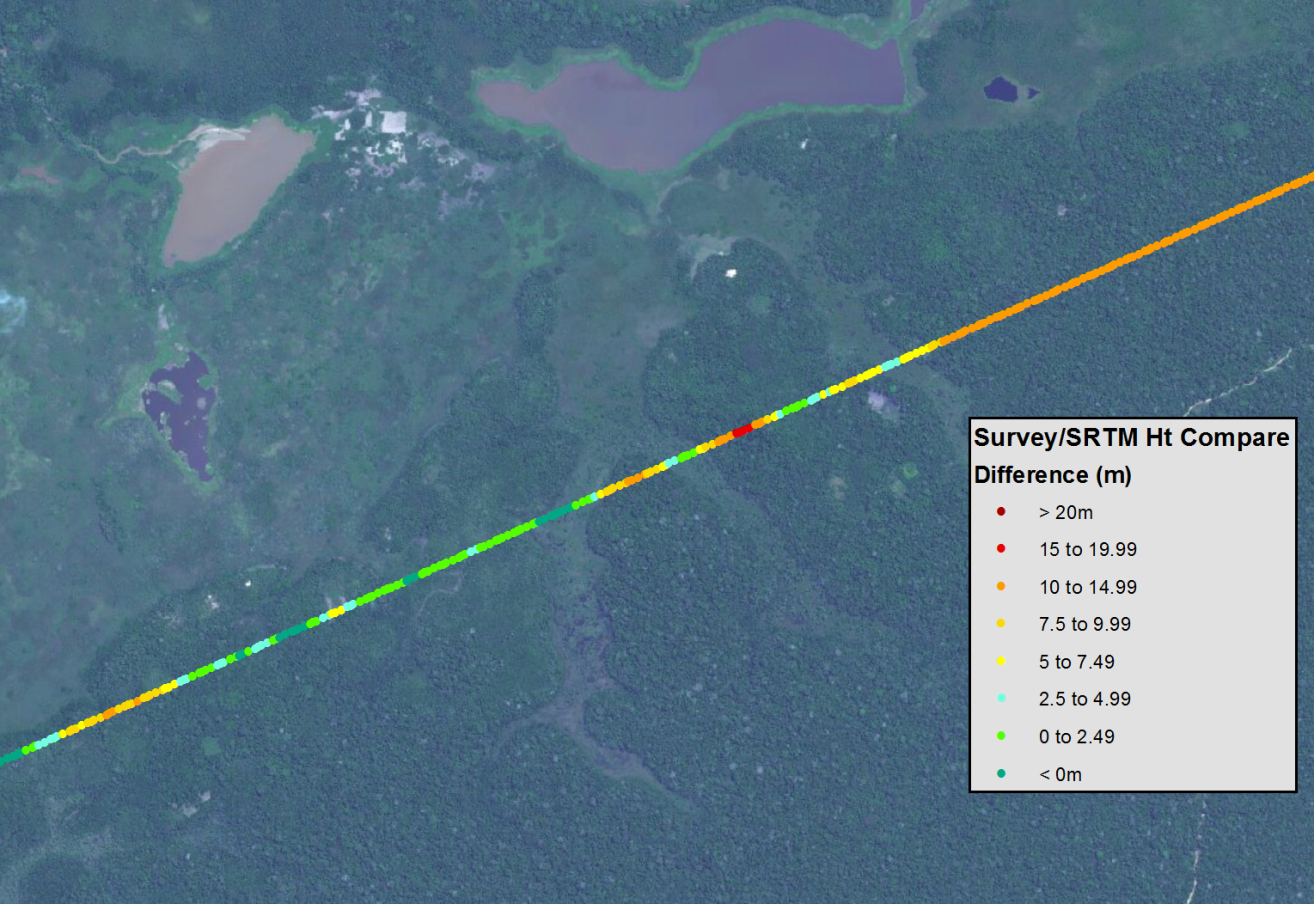
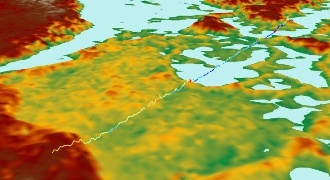
Figure 2: Flood extent modelling.
a) Flood simulation: no flooding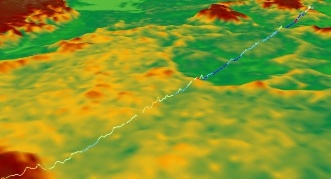 | b) Flood simulation: 155 m elevation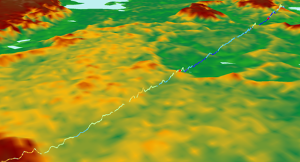 |
c) Flood simulation: 160 m elevation
| d) Flood simulation: 165 m elevation
|
In this example, the seismic acquisition project went on standby for several months while the river levels where deemed too high based on irregular visual observations. With better access to relevant flood extent information, a contingency plan for operations could have been initiated and in the very least a confident and considered decision made when operations could resume again as the flood waters recede.
The SRTM data set is a very useful product, but should be used with caution in forested regions. The use of C-band InSAR also means penetration of forest canopy is poor which can result in vertical errors of up to 20m in tree covered regions. All of this needs to be understood before utilising SRTM data for survey planning.
One important benefit of the SRTM data set is that it is freely available and has global coverage. Aerial surveys were too costly to be considered for this project. Elevation products such as Elevation 8 and Elevation 12 may provide operational benefit, but at increased cost, and in this case coverage was not available off the shelf for the area of interest.
In addition to a more detailed DTM surface model, accurate temporal river level and flood extent observation data would have allowed for a much more flexible approach to river monitoring and flood planning. River height gauges would be impractical in such an environment and prohibitively expensive to set up in advance of planning. The use of radar and optical EO to observe the extent of flooding in near-real time would provide valuable information for planning and modification of survey activities. Products are potentially availability at low cost, for example if products are based on Sentinel-1, Sentinel-2, Landsat-8, or other low cost “persistent monitoring” systems.
Overall, it is recognized that the combination of a “bare earth” DTM and relevant time stamped river elevations would enable effective flood extent area analysis. Coupled with observations of an area in near-real time, seismic logistics planning could be more responsive to environmental conditions.
This page has no comments.