Multiple remote sensing products were applied for flood risk mapping and analysis in the Turkana region of Kenya. Using a digital terrain model (DTM) and flood extents and surface properties derived from satellite earth observation (EO), it was possible to outline potential areas of flooding that might cause delay and increased cost during seismic survey operations. While providing excellent advance information, field verification was still required to assess and understand the actual ground conditions and characteristics.
A seismic survey within the Turkana region of Kenya needed to be completed with minimal time spent in the field during the local wet season period. It is generally accepted that the rainy season is from March to May; however, this time period and the amount of precipitation can vary considerably throughout the region. With the survey being carried out in a flood risk area, the likely ground conditions needed to be assessed to establish whether vibrator and vehicle movements would be adversely affected. Due to security and political difficulties within the region, site visits were not permitted far in advance of the survey date. With these constraints in place there was a requirement for a flood risk mitigation strategy for the seismic survey, which included flood risk mapping and assessment of likely ground surface conditions, to determine if the operation could go ahead.
The goal was to provide detailed environmental information at the planning stage to minimize the amount of time spent in the field as well as potential downtime due to adverse environmental conditions. This would avoid additional survey costs due to stand-by (periods in which the operator cannot proceed) and, more importantly, deliver the final seismic acquisition product on time.
To address the project needs, an accurate digital terrain model (DTM) on which to plan/develop the flood mapping was required. Water level data could then be superimposed over the terrain and flooding patterns could be assessed. Availability of a DTM was a major concern, with local data being difficult to obtain but global data perhaps not having the required detail and accuracy to highlight subtle changes in elevation. Similar projects in different regions had access to river height gauges and historic governmental flood data, but both of these were unavailable in the short time frame for this survey location.
Following evaluation of the options, satellite EO was selected as the best solution to deliver terrain and flood modelling information as desktop studies without the need to visit sites. Satellite EO would also prove a much more cost-effective method than detailed aerial remote sensing, which would have cost over $500,000 to acquire.
Three remote sensing products were utilised in the assessment of ground conditions:
- DTM derived from the Shuttle Radar Topography Mission (SRTM-90);
- Surface water extent models from the Moderate-Resolution Imaging Spectroradiometer (MODIS) instrument, which was provided through the Dartmouth Flood Observatory; and
- High resolution (1.5 m) SPOT-6 images to provide detailed information on surface reflectance properties within the floodplain (sourced commercially).
Data integration, analysis and visualisation were completed using ESRI ArcMap software. The overall activities are:
- Collection of DTM (SRTM-90) and flood extent zones (Dartmouth Flood Observatory);
- Comparison of MODIS flood risk areas and SPOT-6 imagery;
- Identification of low lying, low gradient areas (potential flood risk zones);
- Verification against legacy flood datasets; and
- Identification of planned seismic survey areas at risk from flood.
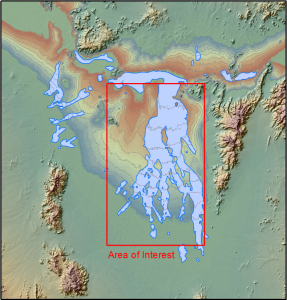
Data processing was completed using ESRI ArcMap software. SRTM-90 elevation and MODIS derived flood extent data (as identified by the Dartmouth Flood Observatory) were collected. Figure 1 shows elevation ranges scaled to emphasise flat areas, with extracted 5 m contours overlain. The cumulative flood extent limit is also shown as derived for the years 2002, 2005, 2006, 2011, 2012, and 2013. Significant variation in elevation is present even in relatively flat areas.
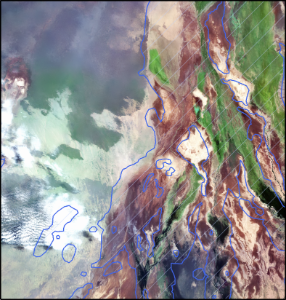
Combining both elevation and historic flood data, it was possible to identify low lying, low gradient areas that were potential flood risk zones. The identified flood risk areas were then compared to SPOT-6 satellite image data, which showed a correlation between the DTM and the flood extents and a visual change in ground characteristics within these extents, as illustrated in Figure 2.
These flood prone areas were cross referenced against the planned seismic survey to identify seismic lines that could potentially present difficulties associated with flooding or wet ground when acquisition was carried out. As the flood susceptible area represented a considerable part of the acquisition target area, it was difficult to propose a suitable operation contingency plan avoiding the questionable areas during the worst months. Ground conditions and soil composition were left as unknowns in the planning process to be addressed once operations were initiated.
The flood prone areas were identified successfully from analysis of existing satellite EO datasets. The EO datasets are useful at the start of the planning process to quantify potential issues caused by flooding and wet ground, but further desirable information would include soil composition and stability to establish whether the identified areas are capable of supporting heavy machinery and vehicles without causing too much damage or delaying operations, and whether this changes depending on the season.
The seismic survey was concluded with no major time extensions and with limited standby time caused by flooding, partly due to lower than average rainfall for the survey acquisition time window. Some logistical problems were associated with wet ground but these could not have been avoided; however a better understanding of them beforehand would have been beneficial – see Figure 3.
Figure 1: SRTM-90 variation in flood prone areas
Showing 5 m contours superimposed on historic flood limits:
2002, 2005, 2006, 2011, 2012, 2013.
Figure 2: SPOT-6 (1.5 m) colour image and flood limits
Image variations correspond to flood prone areas – comparison to historic flood extents.
Figure 3: Typical landscape and flood associated problems
Due to time constraints, health and safety and security risks, and associated costs, it is not always possible to conduct field verification visits. In this example, due to license agreement commitments operations had to be carried out in a time frame that overlapped the rainy season. The object of the pre-survey EO-based study was to identify any issues that might arise due to adverse weather conditions in the operation window chosen and potentially quantify additional costs and delays.
Future improvements in the products could be possible with access to additional datasets:
- Analyse historical radar datasets covering the area during flooding season, to detect the extent of flood waters compared to dry season conditions and MODIS products;
- Analyse optical and radar datasets in near real time, e.g. radar from Sentinel-1, which would provide additional situational awareness information during a survey regarding the extent of water bodies and flooded areas; and
- Improved information on ground conditions, for example using a soil wetness index from multi-spectral data such as SPOT-6 or Sentinel-2 (when available).


This page has no comments.