The Joint Oil Sands Monitoring Plan (JOSMP) is a comprehensive, integrated, and transparent environmental monitoring program for the Athabasca Oil Sands region in northern Alberta, Canada, an area of more than 30,000 km2.
Monitoring includes the impact of land cover change through Oil Sands development on the hydrologic function of tributaries to the Athabasca River, the major river flowing through the region. Earth observation (EO) data are used to determine the extent of watershed disturbance as an input to water balance modelling to estimate the annual change in hydrological function from baseline (pre-development) conditions. EO-based monitoring began in 2005 using Landsat TM data. This approach was improved through the use of SPOT-5 and, more recently, RapidEye images. Methods of land change detection also improved, to include the use of image-image change detection and object-oriented feature extraction. Manual review and editing of the dataset is still required, including verification directly with companies.
Background
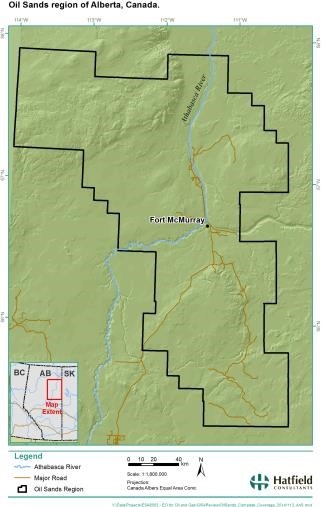
The Athabasca Oil Sands is a strategic oil and gas resource in northern Alberta, Canada (Figure 1). Oil Sands operations extract bitumen deposits through surface mining or in situ extraction methods; the latter typically involves injection of steam at depth to enable bitumen to flow and be extracted using wells. Surface mining operations are concentrated to the north of the town of Fort McMurray where the overburden is shallow enough for cost-effective mining. The in situ operations are south of Fort McMurray and to the east and west of the surface mineable area.
The Athabasca River flows south to north through the Oil Sands region to the Peace-Athabasca Delta at the border of Alberta and the Northwest Territories. The use of water in Oil Sands operations and impacts on water quality and quantity of the water in the Athabasca River and other lakes and rivers is a key concern to O&G companies and the provincial and federal government regulators.
Oil Sands mining areas have no natural exchange of water with the rest of the watershed and are designated as hydrologically closed-circuited. Other developed areas (e.g., cleared land) may still have natural exchange of water with the rest of the watershed. Watershed disturbance, closed-circuited watershed areas, and industrial water withdrawals have the potential to impact surface water flow in aquatic ecosystems, including the connectivity of river channels to allow fish access to spawning grounds in late winter.
Regional monitoring of the aquatic environment was established through the Regional Aquatics Monitoring Program (RAMP) in 1997. Monitoring has been enhanced through the Joint Oil Sands Monitoring Plan (JOSMP) in 2012. JOSMP is an industry-funded, independent, multi-stakeholder initiative, led by the provincial and federal governments, that monitors the environment in the Oil Sands region – an area of more than 30,000 km2. JOSMP conducts integrated monitoring activities so that long-term trends and regional issues can be identified and addressed.
A specific challenge for monitoring is to understand the impact of land cover change and Oil Sands development on the hydrologic function of tributaries to the Athabasca River. To address this challenge, JOSMP monitors the extent of watershed disturbance and conducts water balance modelling to estimate the change in hydrological function from baseline conditions.
Monitoring undertaken by JOSMP includes climate and hydrology through a network of stations established on key tributaries to the Athabasca River. The climatology and hydrology data provide the means to monitor discharge from tributaries into the Athabasca River. Land use change and water use by industry influences the natural hydrograph. Land cover and land use monitoring is required to develop a water balance model to quantify the influence of Oil Sands projects on the overall hydrograph for a particular year.
Land cover and land use are derived from EO data. Monitoring began in 2005 using Landsat TM data, but from 2006 to 2013, SPOT-5 data at 10-m resolution were used for more detailed disturbance monitoring. In 2014, RapidEye data were used to further improve the spatial resolution of mapping of disturbance over this large area (Table 1). While land cover change can be mapped accurately with EO data, industry must provide land use datasets to confirm the areas that are hydrologically-closed from the Athabasca River system.
Table 1 Comparison of EO dataset used for regional monitoring.
| Landsat TM | SPOT-5 | RapidEye | ||
Spatial resolution | 30 m | 10 m | 5 m | ||
Approximate data cost (USD/km2) | Free | 2.34 | 1.25 | ||
Minimum mapping unit | 2 ha (20,000 m2) | 1 ha (10,000 m2) | 0.5 ha (5,000 m2) | ||
Mapping scale | 1:100,000 | 1:40,000 | 1:20,000 | ||
Image thumbnail displayed at RapidEye raster resolution |
|
|
| ||
The overall activities are:
- Develop baseline land cover map (2005/2006 initial baseline);
- Conduct image-to-image change detection;
- Feature extraction of areas of change
- Compare results to industry land use data;
- Verification process with industry; and
- Land cover and land use data integrated into watershed hydrologic analysis.
Technical development in the change detection approach included multi-temporal image segmentation and development of classification “rulesets” (object segmentation approach). These methods incorporate spatial and spectral factors, as well as baseline GIS data, to reduce subjectivity in delineating land cover and land use.
Outcomes
Information on land cover and land use is provided on a watershed basis for the entire Oil Sands region on an annual basis. An example is provided for the Muskeg River Watershed (143,300 ha) between 2005 and 2013 (Figure 2). The change analysis between years identified that disturbed areas increased from 8,500 ha in 2005 to 22,830 ha in 2013, representing almost 16% of the total watershed. A total of almost 9% was closed circuited (Figure 3).
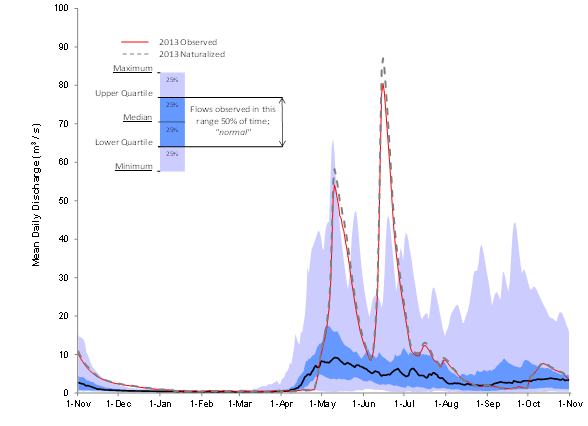
A water balance model integrates these changes in watershed function with data on water use and water discharge provided by the companies operating within the Muskeg watershed. The combined EO-derived information, hydrological data, and water use information enables the change in function from baseline to be established:
- Minimum open-water discharge +15.32% (high effect);
- Mean open-water discharge -6.12% (moderate effect);
- Maximum open-water discharge -7.40% (moderate effect); and
- Mean winter discharge -0.25% (negligible-low effect).
Note: Open-water refers to the period of record that is not affected by ice conditions in the river, which generally refers to data from early May to late October in the Oil Sands region.
The largest effect on the Muskeg River occurs during the open-water low-flow period, which increases minimum discharge compared to the natural low-flow record. The watershed disturbance has a moderate effect on mean and maximum discharge, primarily as a result of the development of closed-circuited areas.
Figure 2: Summary of disturbance of the Muskeg river watershed.
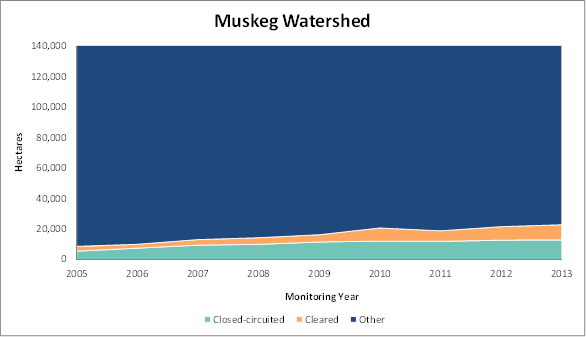
Figure 3: Disturbance of the Muskeg river watershed in 2013.
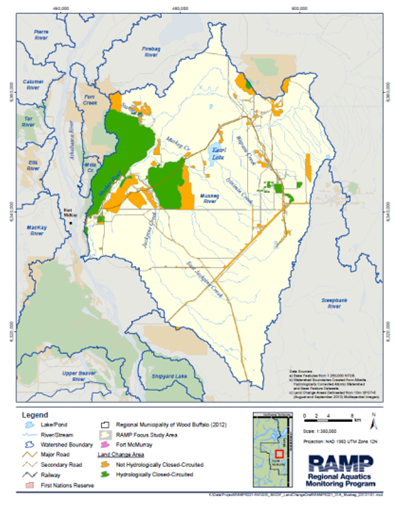
Figure 4: Hydrograph analysis for Muskeg River watershed – 2013 observed vs. naturalized flows
Lessons Learned
The watershed monitoring and modelling provides valuable experience in operational application of EO in a region covering a large area for cumulative effects monitoring. Image processing methods were designed to be simple and repeatable. New approaches have been successfully developed, including multi-temporal image segmentation and the development of classification ‘rulesets’ that incorporate spatial and spectral parameters. Over time, improved spatial resolution datasets were applied, which have a commercial cost, but provide clear benefits in terms of the size of features that can be reliably mapped.
Monitoring in the Oil Sands region has gone through significant changes following a federal and provincial review of RAMP and institutional arrangements. Under the JOSMP, annual satellite-based watershed monitoring is ongoing. The greatest potential for increased and sustainable application of EO is as a contributing data source in integrated monitoring and modelling. Ongoing engagement with researchers and agencies involved in monitoring hydrologic conditions is required, to ensure that the capabilities of EO are understood and can become part of the integrated solutions.
This page has no comments.