Real-time site and environmental monitoring are essential during the different phases of an Oil and Gas project. It enables to ensure the good progress of the operations while respecting the marine environment. In some dramatic cases, an accident occurs, leading to an oil spill.
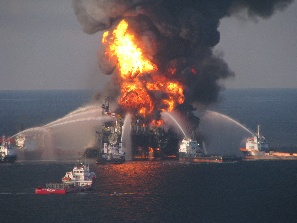
In the Deepwater Horizon case, which occurred in April 2010, the explosion on the drilling rig causes the largest offshore oil spill in U.S. history.
In such an emergency, the SAR images coupled with offshore wind information can be of a great utility to monitor and predict the evolution of the spill and enable the company to take the most responsible actions as fast as possible.
Deepwater Horizon was an ultra-deepwater, dynamically positioned, semi-submersible offshore oil drilling rig. In September 2009, the rig drilled the deepest oil well in history at a vertical depth of 35,050 ft (10,683 m). On 20 April 2010, while drilling at the Macondo Prospect, an explosion on the rig caused by a blowout killed 11 crewmen and ignited a fireball visible from 40 miles (64 km) away. The resulting fire could not be extinguished and, on 22 April 2010, Deepwater Horizon sank, leaving the well gushing at the seabed and causing the largest offshore oil spill in U.S. history. While trying to plug the leak as fast as possible, it is also of significant importance to be able to see the evolution of the oil spill and to be aware of risk assessment of onshore drift.
SAR images combined with in-situ drifters can be of a great help in that case, especially to visualize the slick. The use of SAR-derived wind measurement can also be used to understand and predict its evolution in real time.
In the case of accidental pollution, CLS has developed a strategy to quickly provide answers on the spill evolution to the end users.
Some ancillary information is used to help in understanding the origin of ambiguous slicks on SAR images.
CLS is then able to produce a Near Real Time report containing the following details:
- Results of the analysis of SAR image
- Synthetic presentation of all detected slicks
- Detailed description of each reported slicks
- Information on the local meteo-oceanic conditions
- Oil drift forecast
- Other information (vessesels)
Oil spill detection report and drift forecast is posted on the Web and may be consulted using any browser.
End-users’ notification is done by e-mail, Fax, etc.
Results for the Deepwater Horizon case
In the case of the Deepwater Horizon, CLS was able to quickly acquire the SAR images over the Gulf of Mexico, from whom the following figures below are extracted.
One can distinctly see on the figure 1 the state of the spill on the 26th of April.
The wind information derived from the SAR image shows on figure 2 the direction and the speed of the wind. One can then observe that a moderate West-North West wind is pushing the oil spill away from the shore.
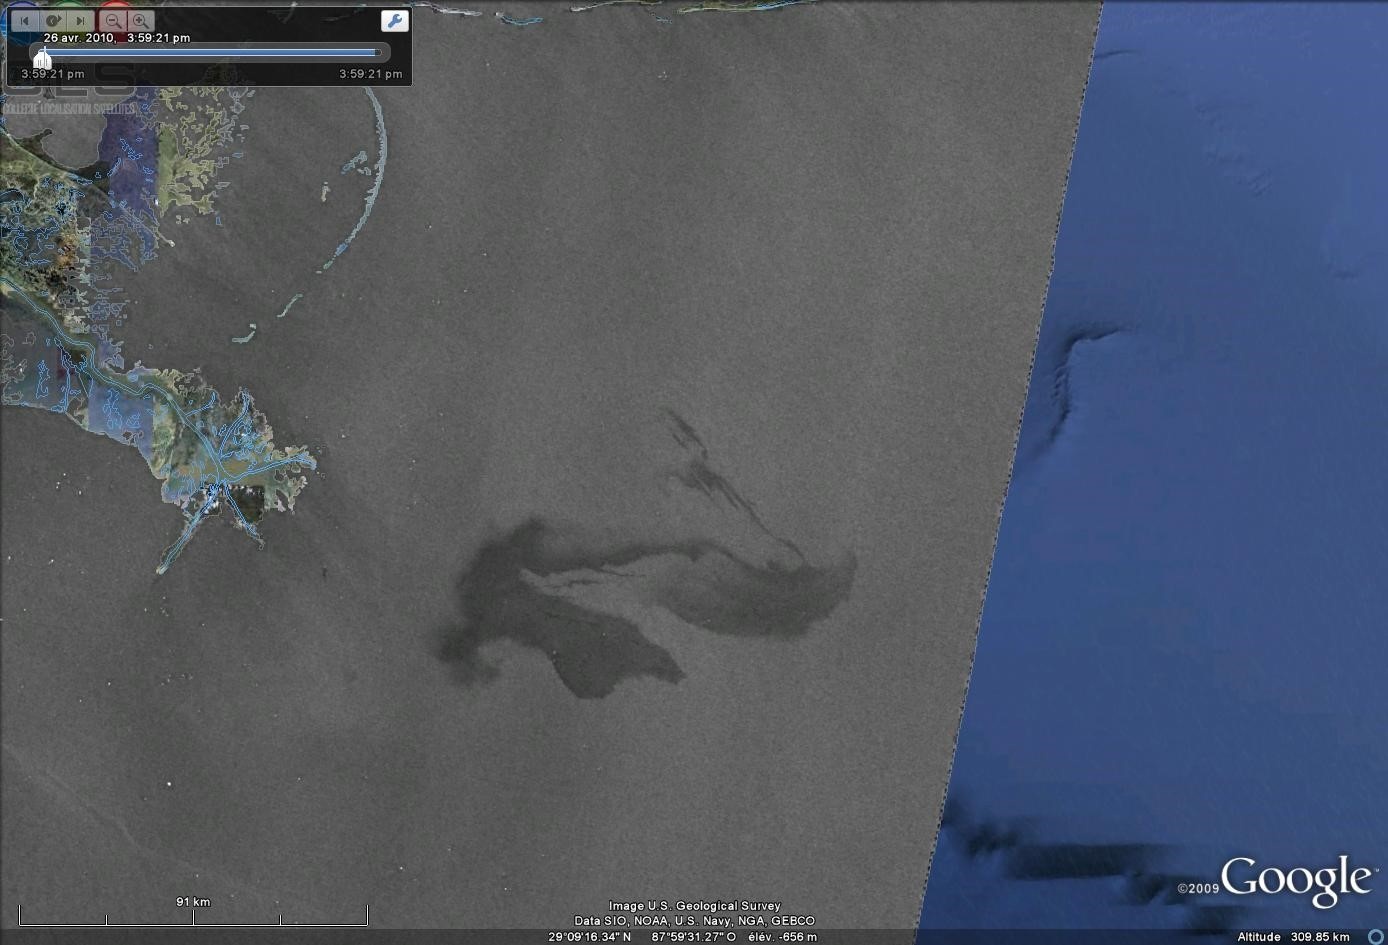
Figure 1 : SAR image from April 26, 2010 - ASAR data Copyright ESA
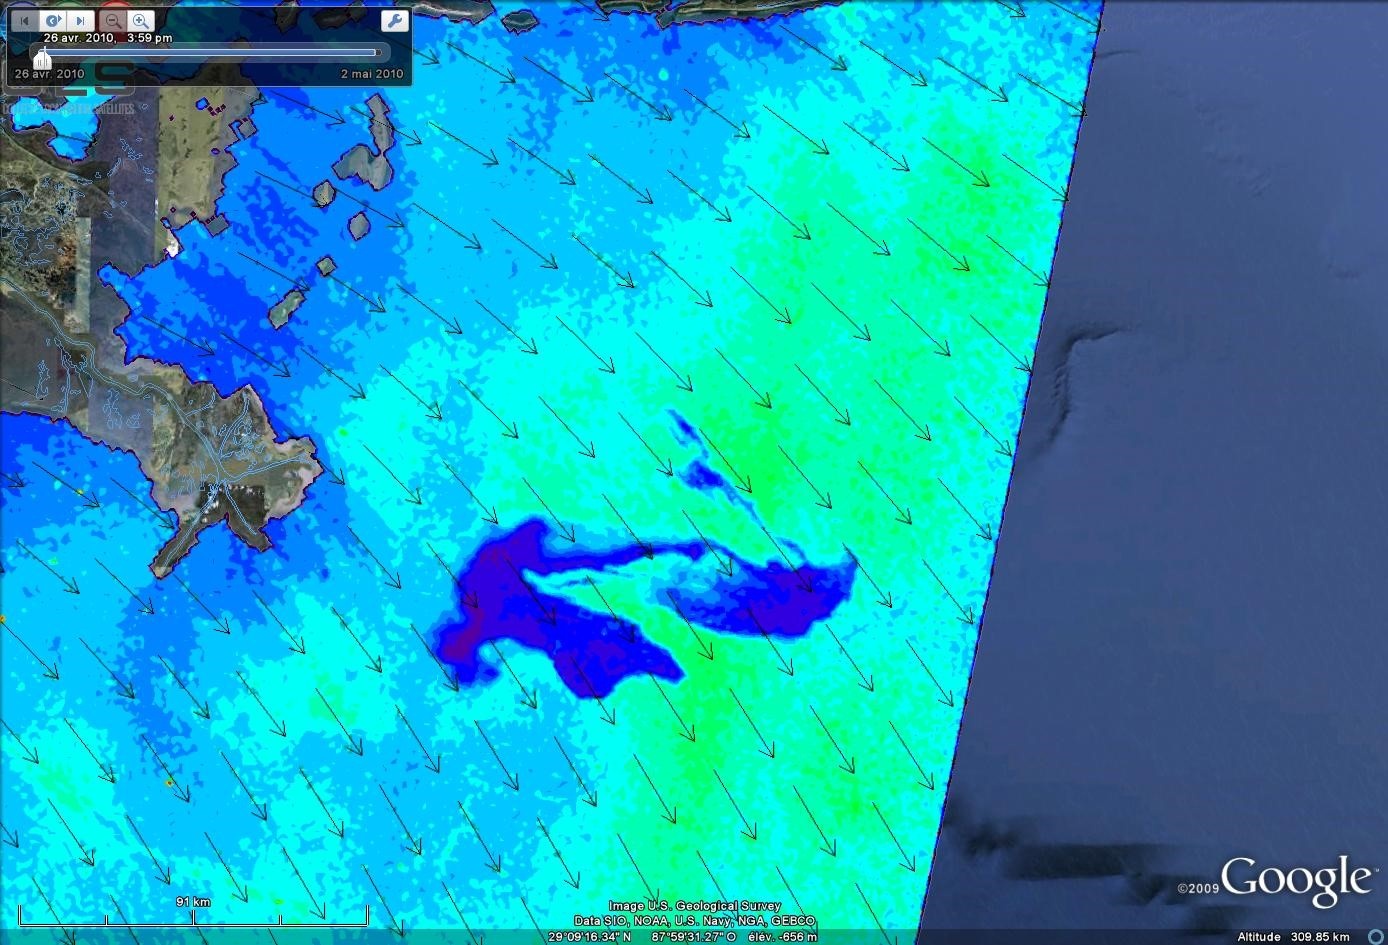
Figure 2 : W-NW wind 7-8 m/s
On the 27th of April 2010, one can still observe the moderate westerly wind pushing oil to the East.
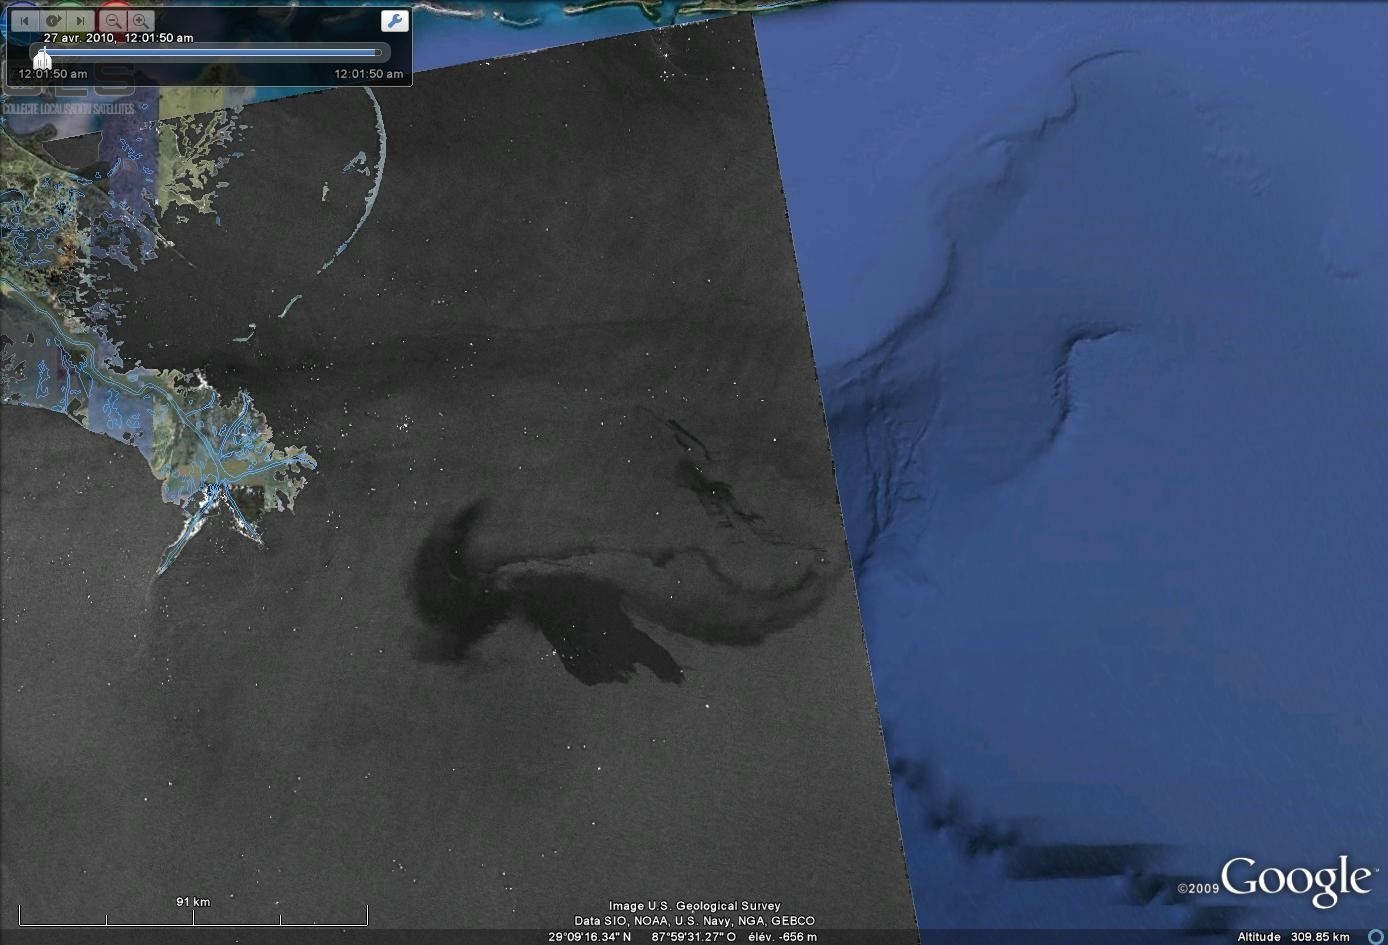
Figure 3 : SAR image from April 27, 2010
RADARSAT-2 Data and Products © MacDONALD, DETTWILER AND ASSOCIATES LTD. (year of acquisition) – All Rights Reserved
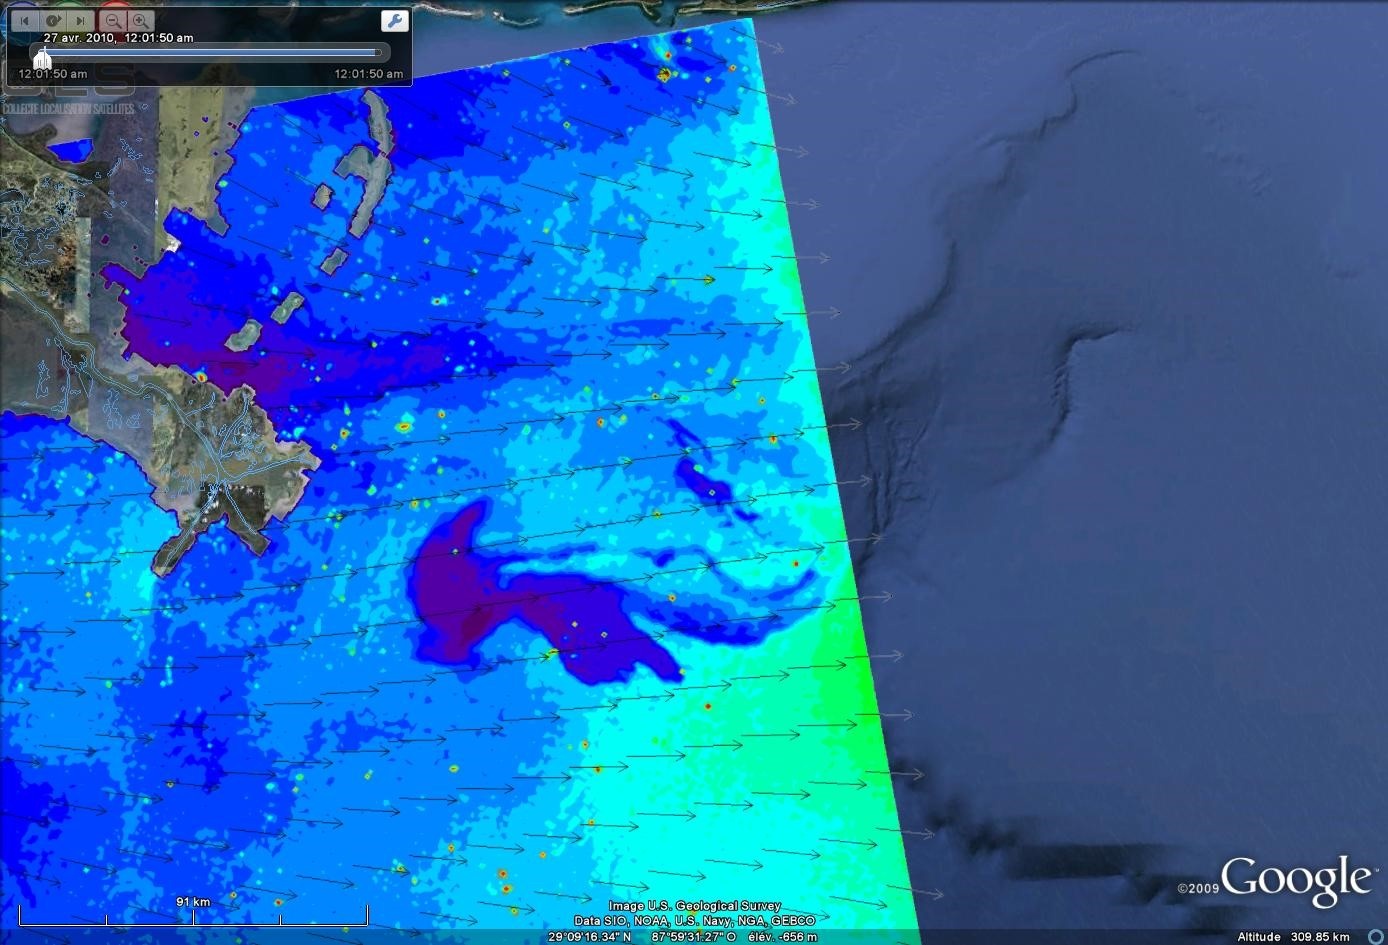
Figure 4 : W wind 5-6 m/s
On the 28th of April 2010, wind becomes lower and its direction changes to North-East.
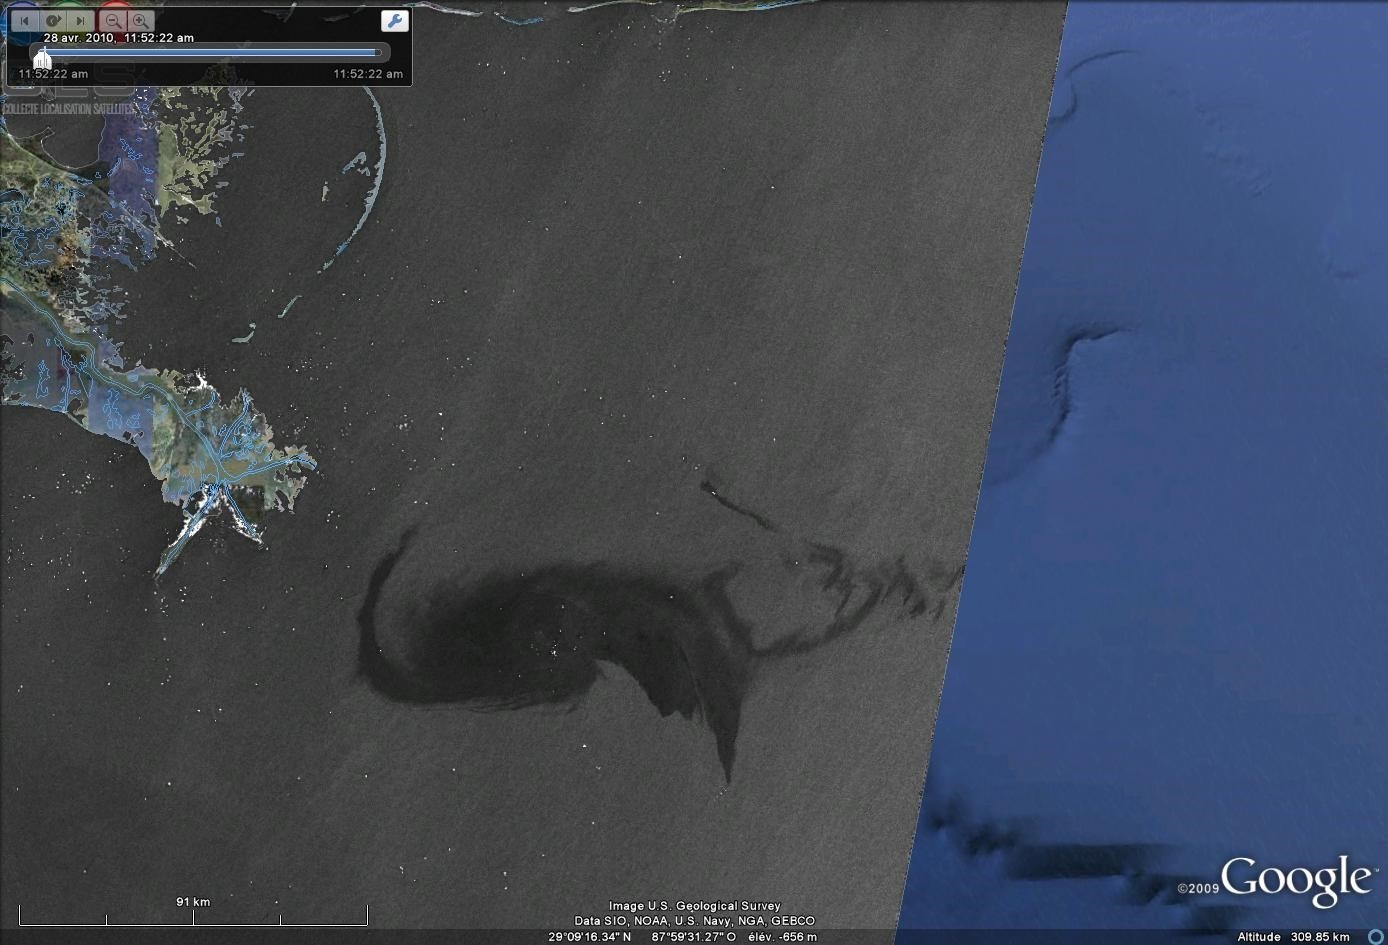
Figure 5 : SAR image from April 28, 2010
RADARSAT-2 Data and Products © MacDONALD, DETTWILER AND ASSOCIATES LTD. (year of acquisition) – All Rights Reserved
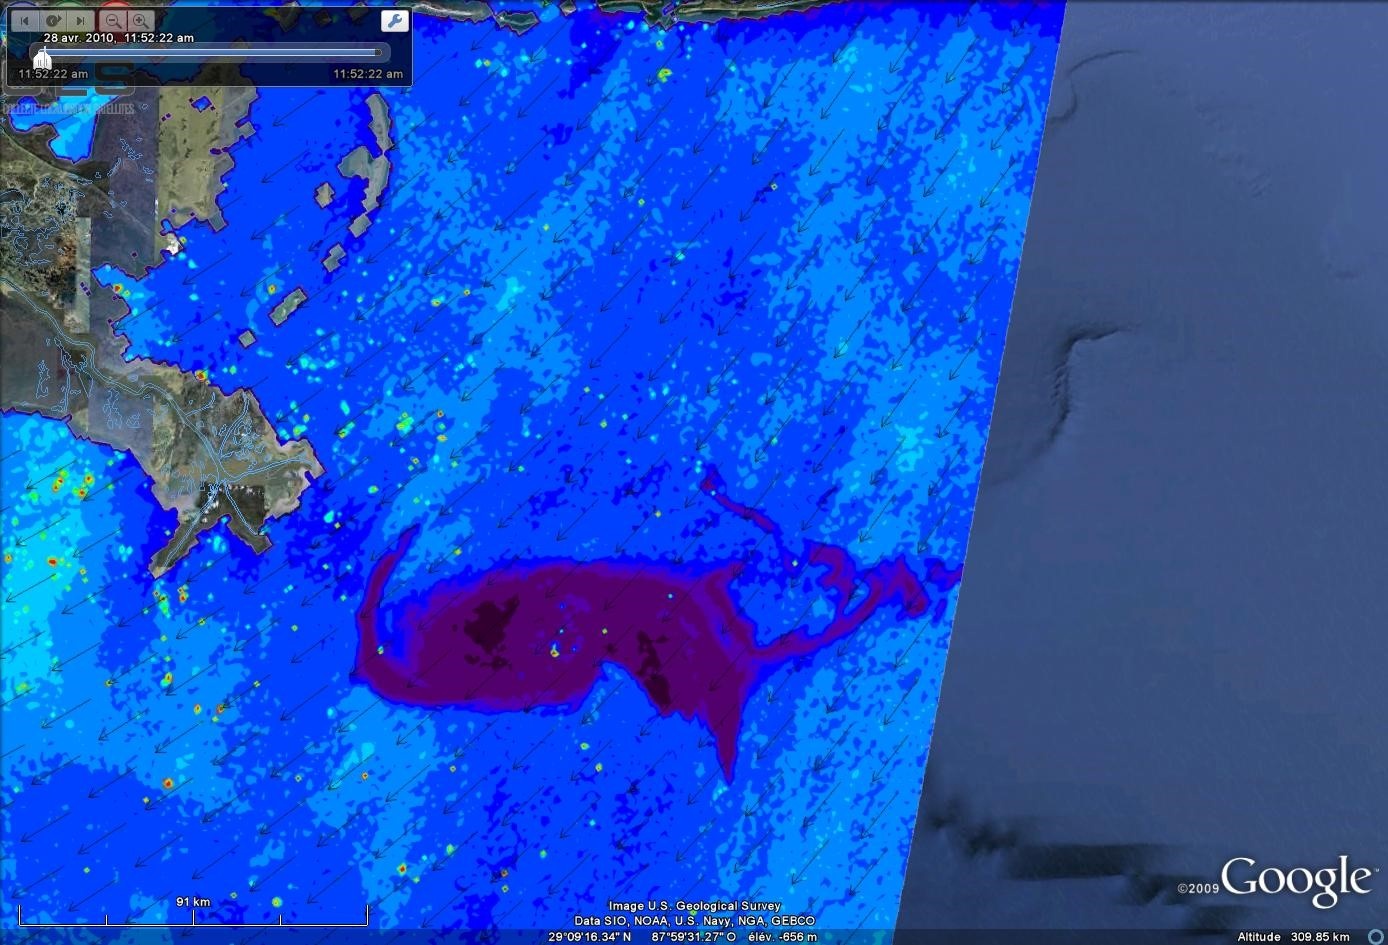
Figure 6 : W wind 4-5 m/s
On the 29th of April 2010, a very low wind region is appearing at the east of oil spill location making oil detection more difficult due to low contrast.The oil spill remains North of the Loop Current highlighted by SAR Doppler analysis (see ESA Web Story) : http://www.esa.int/Our_Activities/Observing_the_Earth/Envisat/Gulf_of_Mexico_oil_spill_in_the_Loop_Current ).
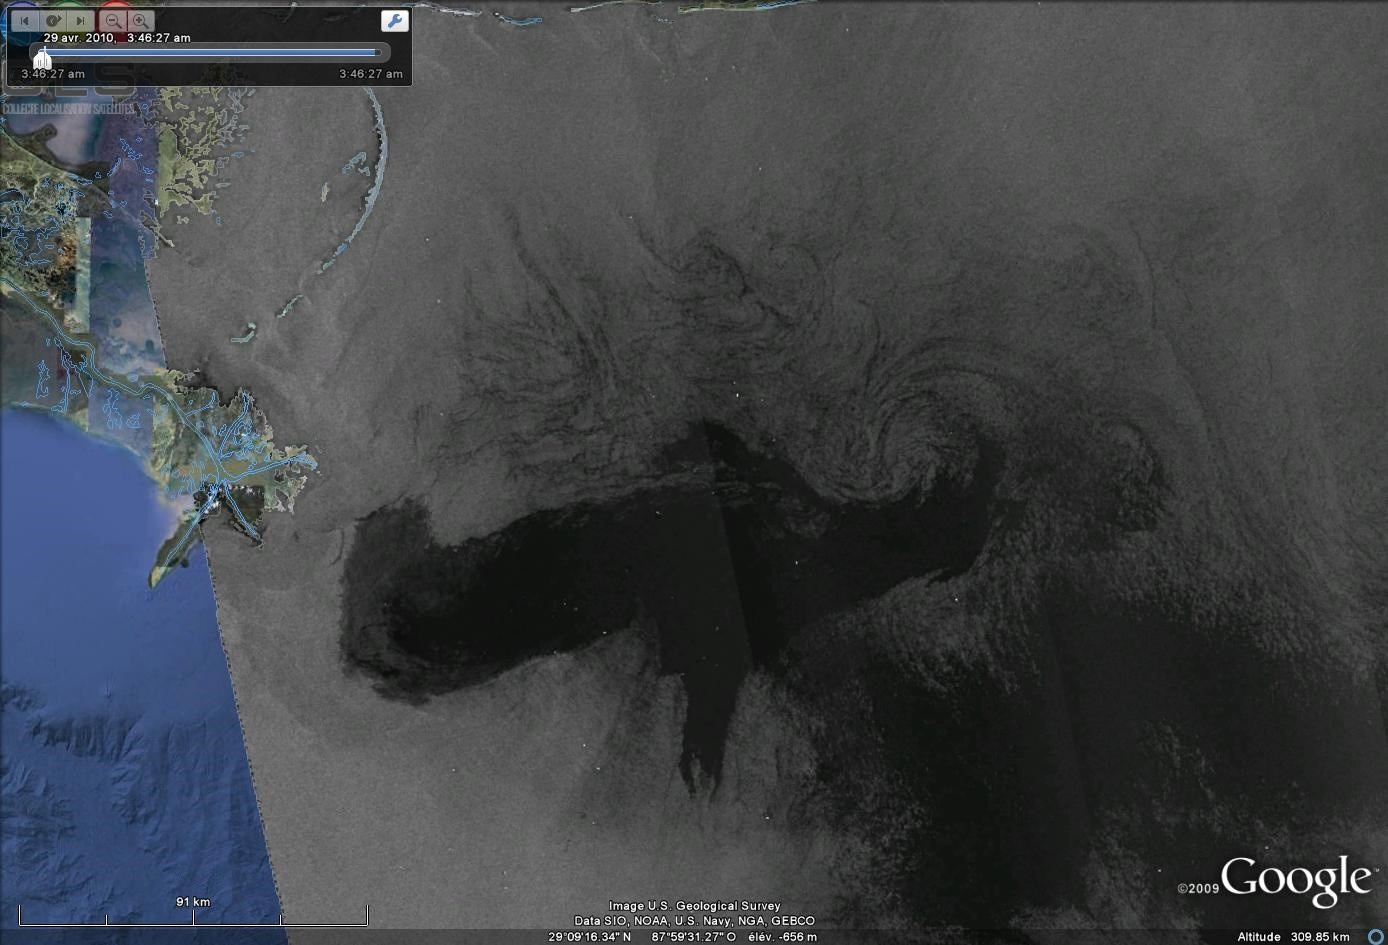
Figure 7 : SAR image from April 29, 2010
ASAR data Copyright ESA
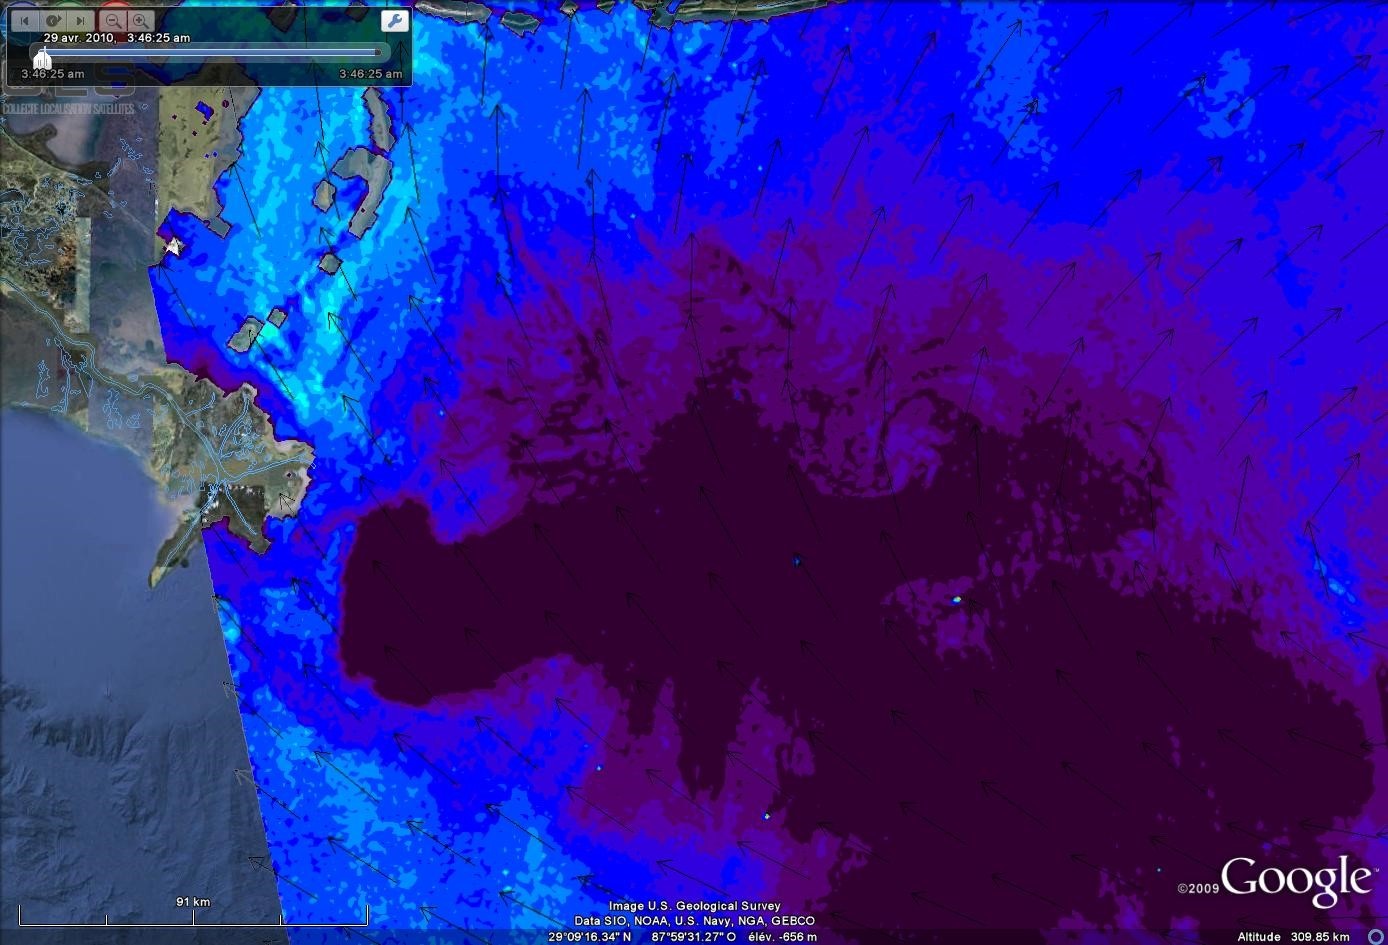
Figure 8: W wind 2-3 m/s
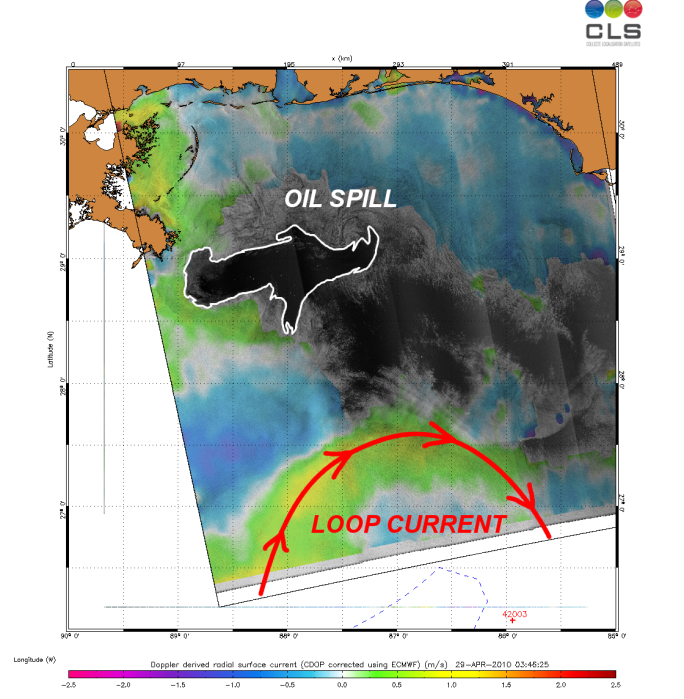
Figure 9 : SAR-dervied sea surface current (radial component) image
On the 2nd of May 2010, strong South-South East wind is pushing oil towards the shore.
The oil spill still remains at the North of the Loop Current.
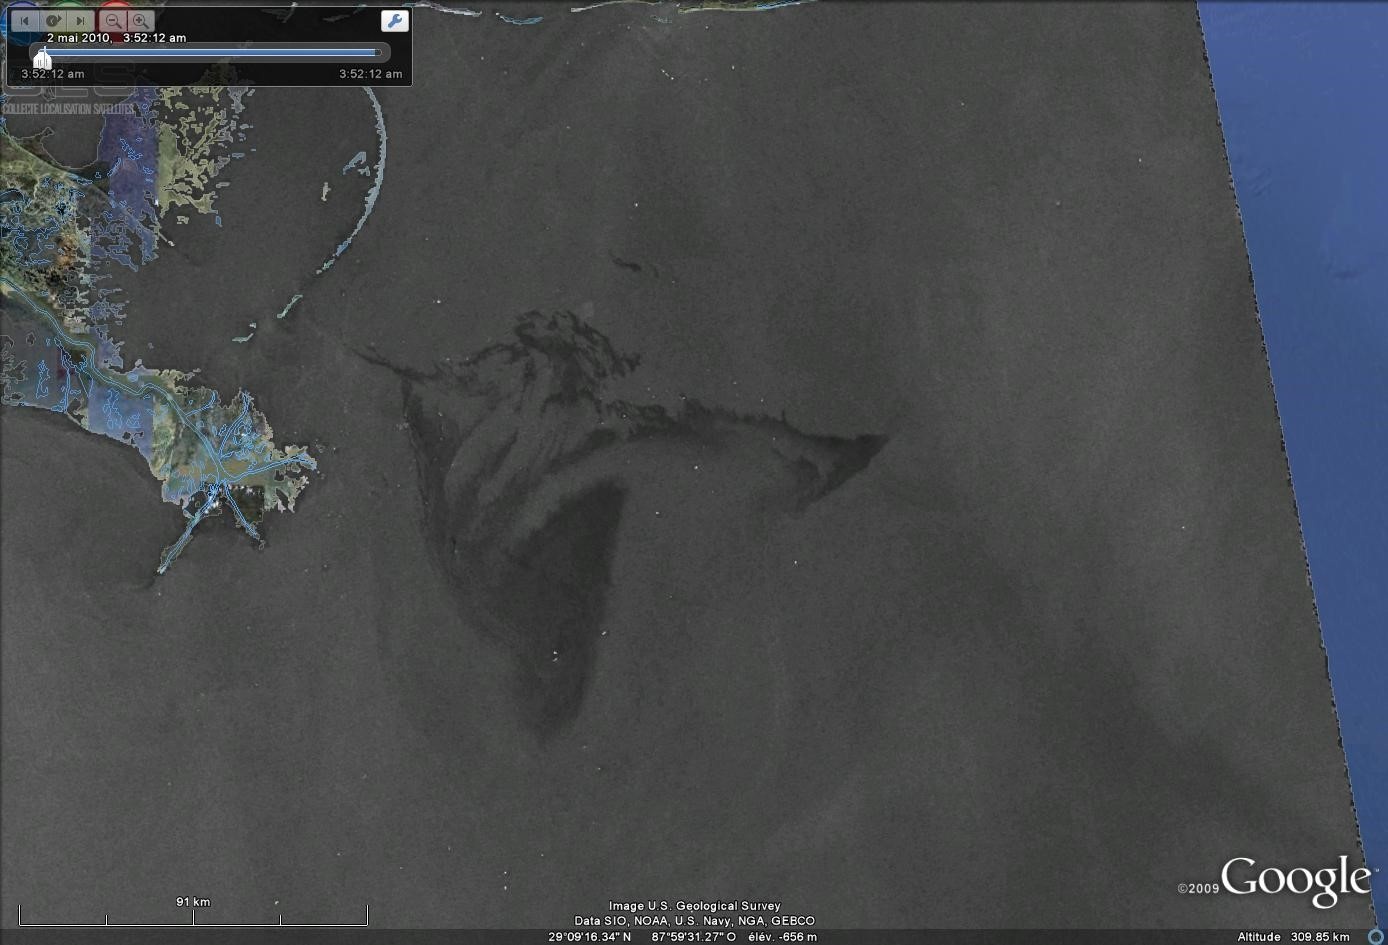
Figure 10 : SAR image from May 2, 2010
ASAR data Copyright ESA
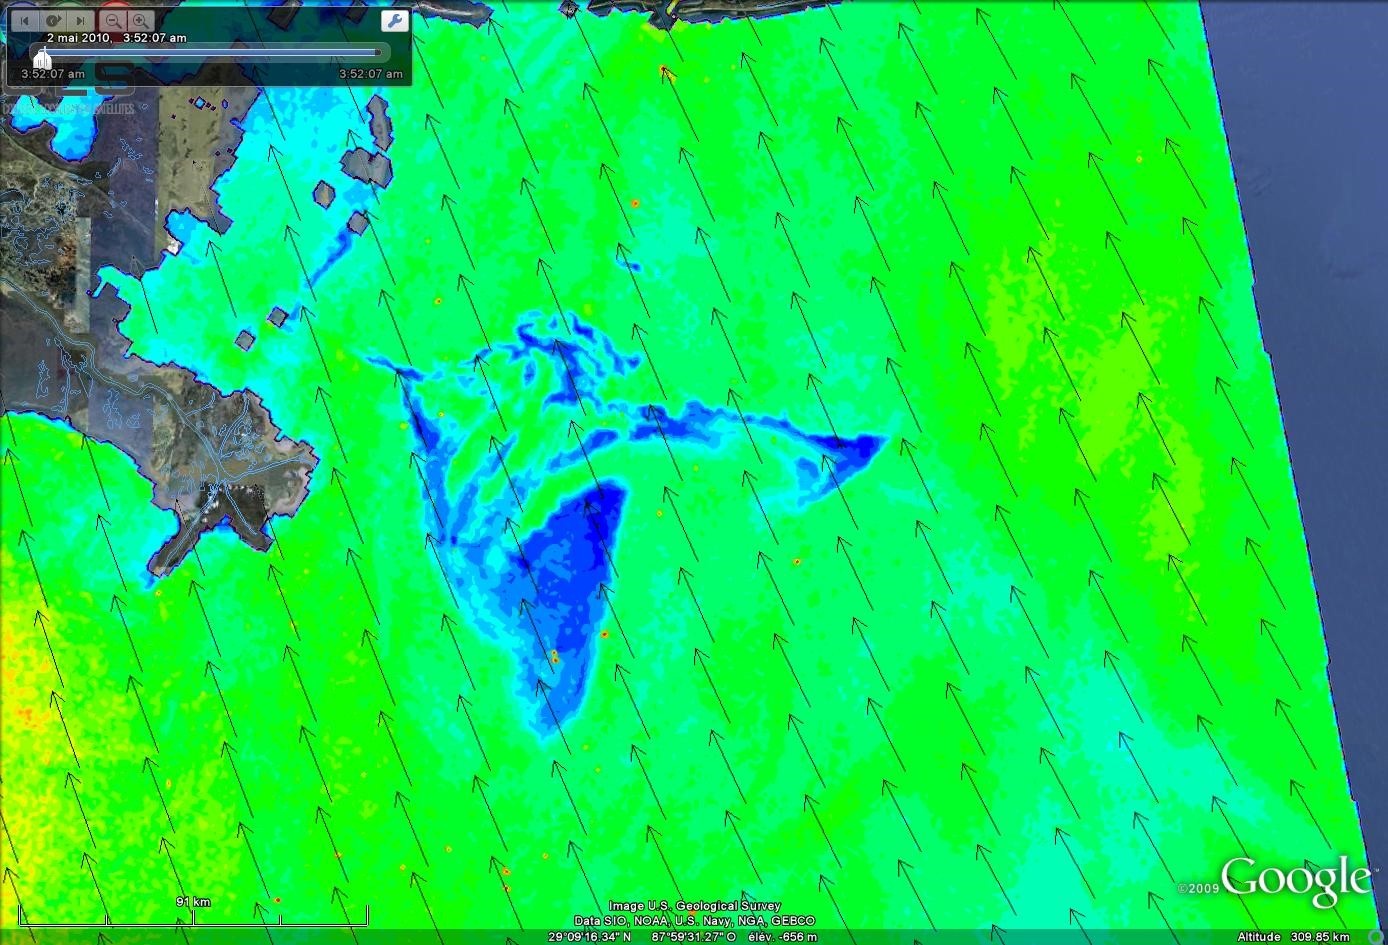
Figure 11 : S-SE wind 12 m/s
The Gulf of Mexico disaster was a very good example of how monitoring the evolution of the oil spill thanks to SAR images was essential. Indeed, it was clear on SAR images that the spill was dangerously approaching the Loop Current. Once it reached the current, it has been estimated that it would be carried south towards coral reefs in the Florida Keys in 6 days. This information remains essential for taking decisions to minimize damage.
CLS has over 25 years of experience in delivering data and services to customers all over the world. With a staff of 470, in France and abroad, CLS offers services in environmental monitoring, maritime security, and management of marine resources to a broad range of professionals including government, industry and the scientific community, and maintains an operational center with expert support 24/7. Since 2001, CLS has developed services for the oil & gas industry based on its built-in expertise on data collection, radar imagery or numerical modelling. For the EO4OG Project, CLS leads a consortium composed of METEO GROUP and NERSC. Tullow Oil kindly supports the team as a consultant.
Contact
Dr. Nicolas Longépé, CLS Brest, nlongepe@cls.fr
This page has no comments.