Applications
Quality, health, safety and environment are four components of seismic survey planning. Satellites provide information for the four of them: remote sensing images can substitute or at least complement ground evaluations, providing map and elevation views of features on and just below the surface.
Satellite data can be used to establish risk factors, for example for seismic source and receiver signal quality and for potential survey damage to the environment. The ability to locate dangerous terrain is essential for protection of health and safety of survey personnel. Remote sensing data are useful for safe deployment of seismic acquisition vehicles and to identify sensitive areas: the use of this information in survey planning minimize the negative impact of seismic acquisition. Time-lapse of satellite images allow mapping seasonal and longer-term changes or of subsidence over a reservoir (1).
During the first stages of exploration satellite data are used to prioritize areas that deserve further exploration. With the different types of available sensors, satellites fit for large survey areas. They can be used to infer the presence of hydrocarbons, delineate fractures or other features of subsurface accumulation. The damping of surface waves may be linked to processes with are not related to the presence of oil and require further investigation. Overall satellite remote-sensing tools are useful for rapid screening of large or inaccessible areas.
Among the valuable inputs that will come from Copernicus infrastructure, Sentinel-1's interferometric modes can be used to conduct run-off and inundation analysis in areas previously lacking elevation data. Ground motions can be screened through InSar techniques which would allow the monitoring of earthquake-prone areas and the discovery of active fault lines. Moreover radar techniques are used to identify terrains prone to landslides and monitor surface deformation, to study pre-eruption uplift and post eruption volcanic shrinkage (2).
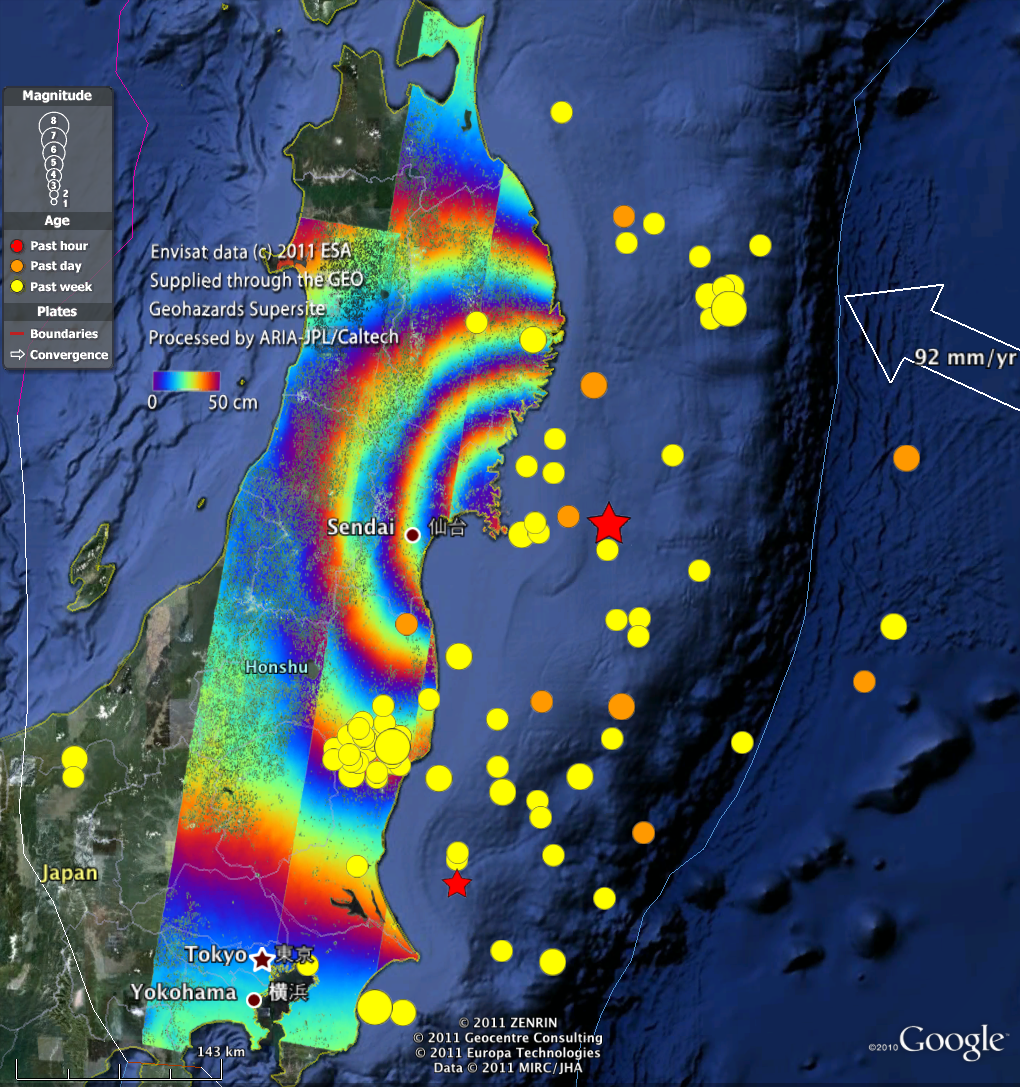
ASAR coseismic interferogram of the 2011 Tohoku-oki earthquake in Japan processed by JPL/Caltech ARIA project using ROI_PAC. One color cycle represents 50 cm of motion in the radar line of sight.
References
(1) https://www.slb.com/~/media/Files/resources/oilfield_review/ors08/win08/satellite_sensing.pdf
(2) https://earth.esa.int/web/sentinel/user-guides/sentinel-1-sar/applications/emergency-management
Success Stories
Topic | Description | Keywords | Reference |
|---|---|---|---|
|
|
|
|


This page has no comments.