Map population distribution
Population distribution mapping using EO data is very useful, particularly for fast-growing or developing countries, where urbanisation creates rapid significant changes in the geographical distribution of population. Population distribution and density are based on the spatial disaggregation of census data using EO-derived lnd cover information. When collected at various administrative levels, census data is often too coarse for direct analysis, but additional information inside each administrative division can be obtained by studying the spatial distribution of land cover types inside each division. Knowing the type of urban fabric (residential or nonresidential) allows for more accurate spatial distribution of information and provides population estimates, for example, at night-time (home) periods, and, provided additional information is available, also for daytime (work) periods. Other EO contributions to population mapping consist in the estimation of the population in informal settlements (e.g. refugee camps) by measuring their spatial extent in very highresolution imagery.
The spatial resolution, frequency and availability of the final products are directly linked to that of the input satellite products. Disaggregation using land cover information can be performed at various scales, from medium- to very highresolution.
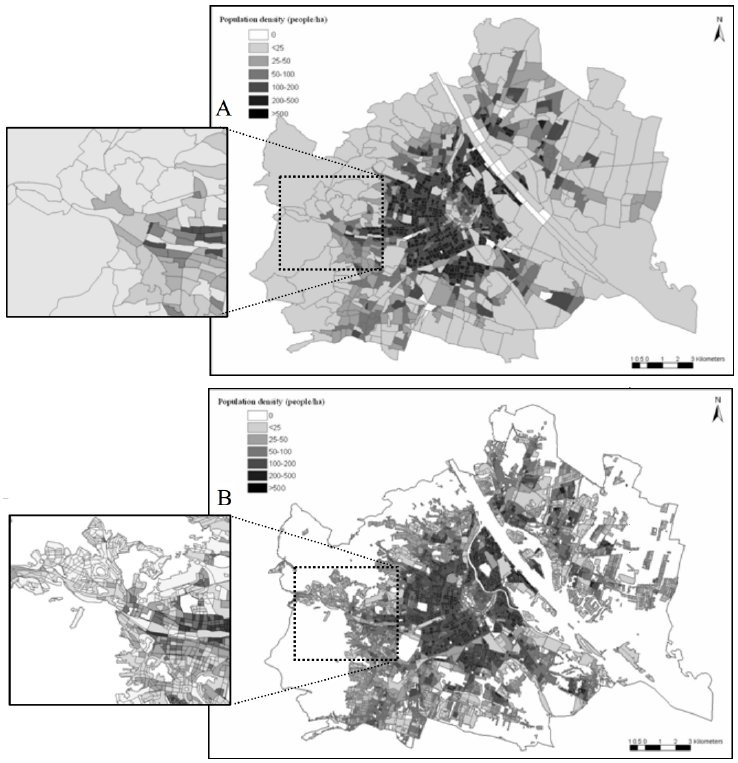
Population density maps for the city of Vienna, Austria, based on census tracts (A) and based on disaggregation using land cover at building block level (B). The “sharpened” real-world population distribution is clearly visible in image B. Credits: GeoVille Austria
Mapping of settlements requires very high-resolution data in the order of 1–5 m. For the disaggregation technique using land cover, the accuracies and constraints discussed in the Urban Mapping section apply, and are naturally influenced by the accuracy of the input census data. The presence of high-rise buildings needs careful consideration, as the vertical component biases the outcome of the spatial disaggregation technique. Population mapping using very high-resolution imagery still suffer from accuracy issues and a lot of detail is required in order to recognise and differentiate man-made structures and their extensions. No global solutions exist, many of the existing solutions apply only regionally and in an ad-hoc manner.
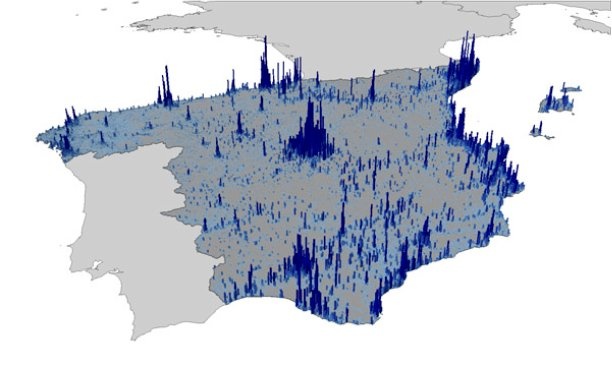
Degree of population redistribution between daytime and night-time in Spain, derived based on census data disaggregation using land cover data. Credits: Geoville Luxembourg.
Nevertheless, presently it is often possible to achieve better results than with existing GIS datasets, which are usually derived from much coarser or more aggregated sources. Information about population distribution is important for planning purposes and geomarketing.
Census data are often only available for large administrative units with arbitrary boundaries that convey a wrong impression of homogeneous population density leading to analytical and cartographic problems. EO data can contribute to refine census information to better reflect reality in terms of spatial distribution of population. The largest potential of the products is in regions and countries where limited information on population distribution is available.
References:
ESA 2013, Earth Observation for Green Growth: An overview of European and Canadian Industrial Capability
This page has no comments.