Landslides
Land slides represent one of the major global natural hazards, causing threat to human life, property, infrastructure and the natural environment. Every year slope instabilities significantly impact societies and economies and since ground surveys are very costly and time consuming, satellite remote sensing is increasingly used to mitigate damage resulting from land slides. Satellite imagery allows for multitemporal and spatial mapping, offering detailed monitoring of changes in the ground surface.
Remote sensing technology can be used in detection, classification and monitoring of landslides and the analysis and prediction of slope failures in space and time. In order to adequately detect and classify landslides, various parameters should be studied including the type of movement and depth to which it has occurred and the degree of present activity of the landslide. Satellite remote sensing enables mapping of size, contrasts, topography and morphology of landslides. In addition it is very useful for monitoring landslide movement by comparing landslide conditions and extent over time, the speed of movement, and the change in the surface topography.
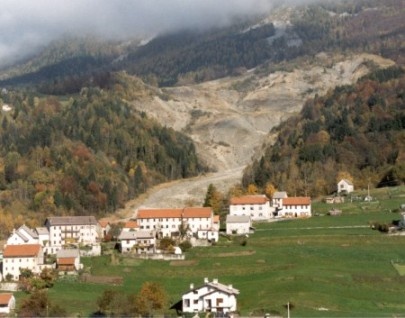
Landslide in Veneto, Italy
There are several remote sensing techniques that can be applied to the studying of landslides. GPS can be used for first stage disaster and further mitigation. It can detect movement and extent of the landslide area. Satellite imagery can help in determining where landslides will or are about to occur. Using stereophotogrammetry, a satellite acquires two images of the same ground scene within a relatively short period of time. The series of images show a three dimensional evolution of the landslide over time.
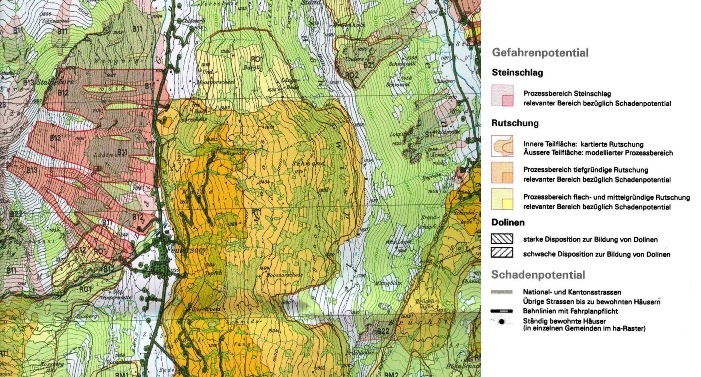
Regional hazard map over an area in western Switzerland showing rock falls in pink and landslides in orange and yellow. Radar data from the Envisat satellite are still being used to support the generation of regional hazard maps. Credit: Canton Bern
As landslides are directly affecting the ground surface, the application of remote sensing technology is most suitable to study and manage slope instabilities. Examples of remote sensors used for the monitoring and management of land slide events are Landsat, SPOT and IKONOS and Quickbird. Digital elevation modelling (DEM) is one of the more frequently used techniques for landslide detection and monitoring using remotely sensed data. Multi-temporal image analysis proves to be very valuable in rapid response when images are generated both before and after the event. Differential interferometry can be used to measure velocities and extent of moving landslides.
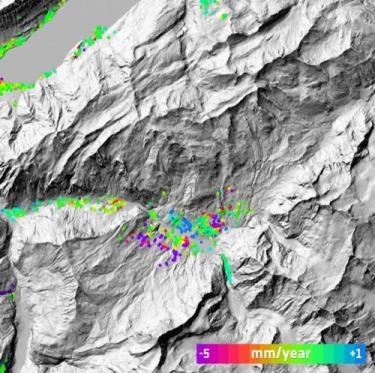
Earth-observing satellites – specifically those equipped with radars, greatly contribute to mapping ground movements such as in the Alpine regions for example. The information generated by Differential Interferometric Synthetic Aperture Radar (DInSAR) is very valuable to local authorities in planning safe and durable infrastructure, as well as for mapping risk to existing infrastructure. Although ESA’s Envisat mission unfortunately ended in April 2012, its radar data are still being used to create regional hazard maps. TerraSAR-X, Cosmo-Skymed and Radarsat-2 for example are currently operating and provide complementary information. The Sentinel-1 mission as part of the future sentinel satellite constellation which is currently being developed by ESA, will be used to monitor landslides and build upon the existing archive.
In the framework of monitoring landslides there exist various collaborations among which the European Landslide Expert Group which is founded and coordinated by the JRC, the International Consortium on Landslides (ICL) which is supported by UNESCO, UN/ISDR, FAO and WMO, the International Programme on Landslides (IPL), the World Landslide Forum, the EU Framework Programme 7 project SAFELAND and the European Centre on Geomorphological Hazards (CERG).


This page has no comments.