Crop Type and Acreage Mapping
Maps of cultivated areas are generated by mid or end of the crop season from local to national level for crop areas of between 1-25ha. Complementary features, derived from independent optical (spectral behavior) and SAR (temporal behavior) data sources are used to delineate the cultivated areas by crop type and emergence date of the different cultures.
Multi-temporal observations from optical sources allow mapping of different crop types, although these can hardly be distinguished when they have similar spectral and temporal characteristics (only crop clusters can be identified in those cases).
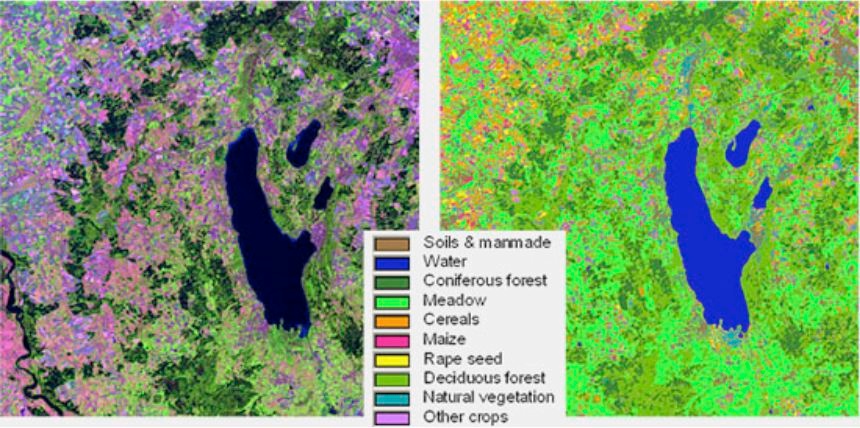 Crop Types/clusters from optical EO data: 30m satellite image in false colours on the left with large-scale agricultural classification on the right.
Credits: VISTA
The service makes use of multi-temporal optical and/or radar data of 10-20m resolution datasets and production is carried out once per year. Data sources mainly include TM/ETM+, SPOT 4/5, Envisat ASAR-AP and ALOS Palsar FM.
Cloud cover is a strong limitation to the optical component of the classifier.Consequently, crop type and acreage from optical data cannot be mapped in rain-fed agricultural fields where crop growth takes place in the rainy season. Thematic accuracy for the optical-derived product is around 70-80%, depending on the completeness of the validation dataset (often ground survey points may be in areas of difficult access). Radar products (e.g. rice) have a higher thematic accuracy of around 80-90%.
Crop inventory is essential for policy, food security programmes and other agro-environmental health investigations as well as being an input tool to support subsidies, certification systems and climate-smart agricultural practices. Often the basic crop type and extent is one of the input variables to production estimates and yield analysis models.
Though optical data have very strong limitations in rain-fed agriculture areas and cannot be used to directly map crop types and acreage in such conditions, the data can provide an extremely efficient and cost-effective support prior to and during field surveys allowing screening of the number of points to be surveyed and validating survey results.
In the future. Sentinels 1 and 2 and other VHR optical and radar satellites will provide continuity and further enhance this service in terms of both spatial resolution and temporal revisit frequency.
References:
ESA 2013, Earth Observation for Green Growth: An overview of European and Canadian Industrial Capability
This page has no comments.