An end-to-end digital consultant at parcel level, providing targeted services that range from the ideal sowing date to the dynamic estimation of phenology and the expected yield.
|
| Farmers, agri-cooperatives, agri-consultants, smart farming service providers, insurance organizations and companies, food & beverage companies, agricultural chemicals companies |


We create and provide data solutions for the farmers and industries that farmers rely on. Farmers, agri-cooperatives, agri-consultants, smart farming service providers, insurance organizations and companies, food & beverage companies, CAP stakeholders (farmers and paying agencies), traders and trading companies are some of already engaged users or potential users/consumers.
Usage of alpha version of Agrowth in the current running cultivation period for the cotton in Greece from several users:
- Neuropublic - Gaia Epixirein | Agri-consultants
- Farmers Cooperative of Orchomenos
- Cotton Farsala | Farmers Cooperative
- Farmers Cooperative of Thessaly "THESgi"
![]()
![]()
![]()
![]()
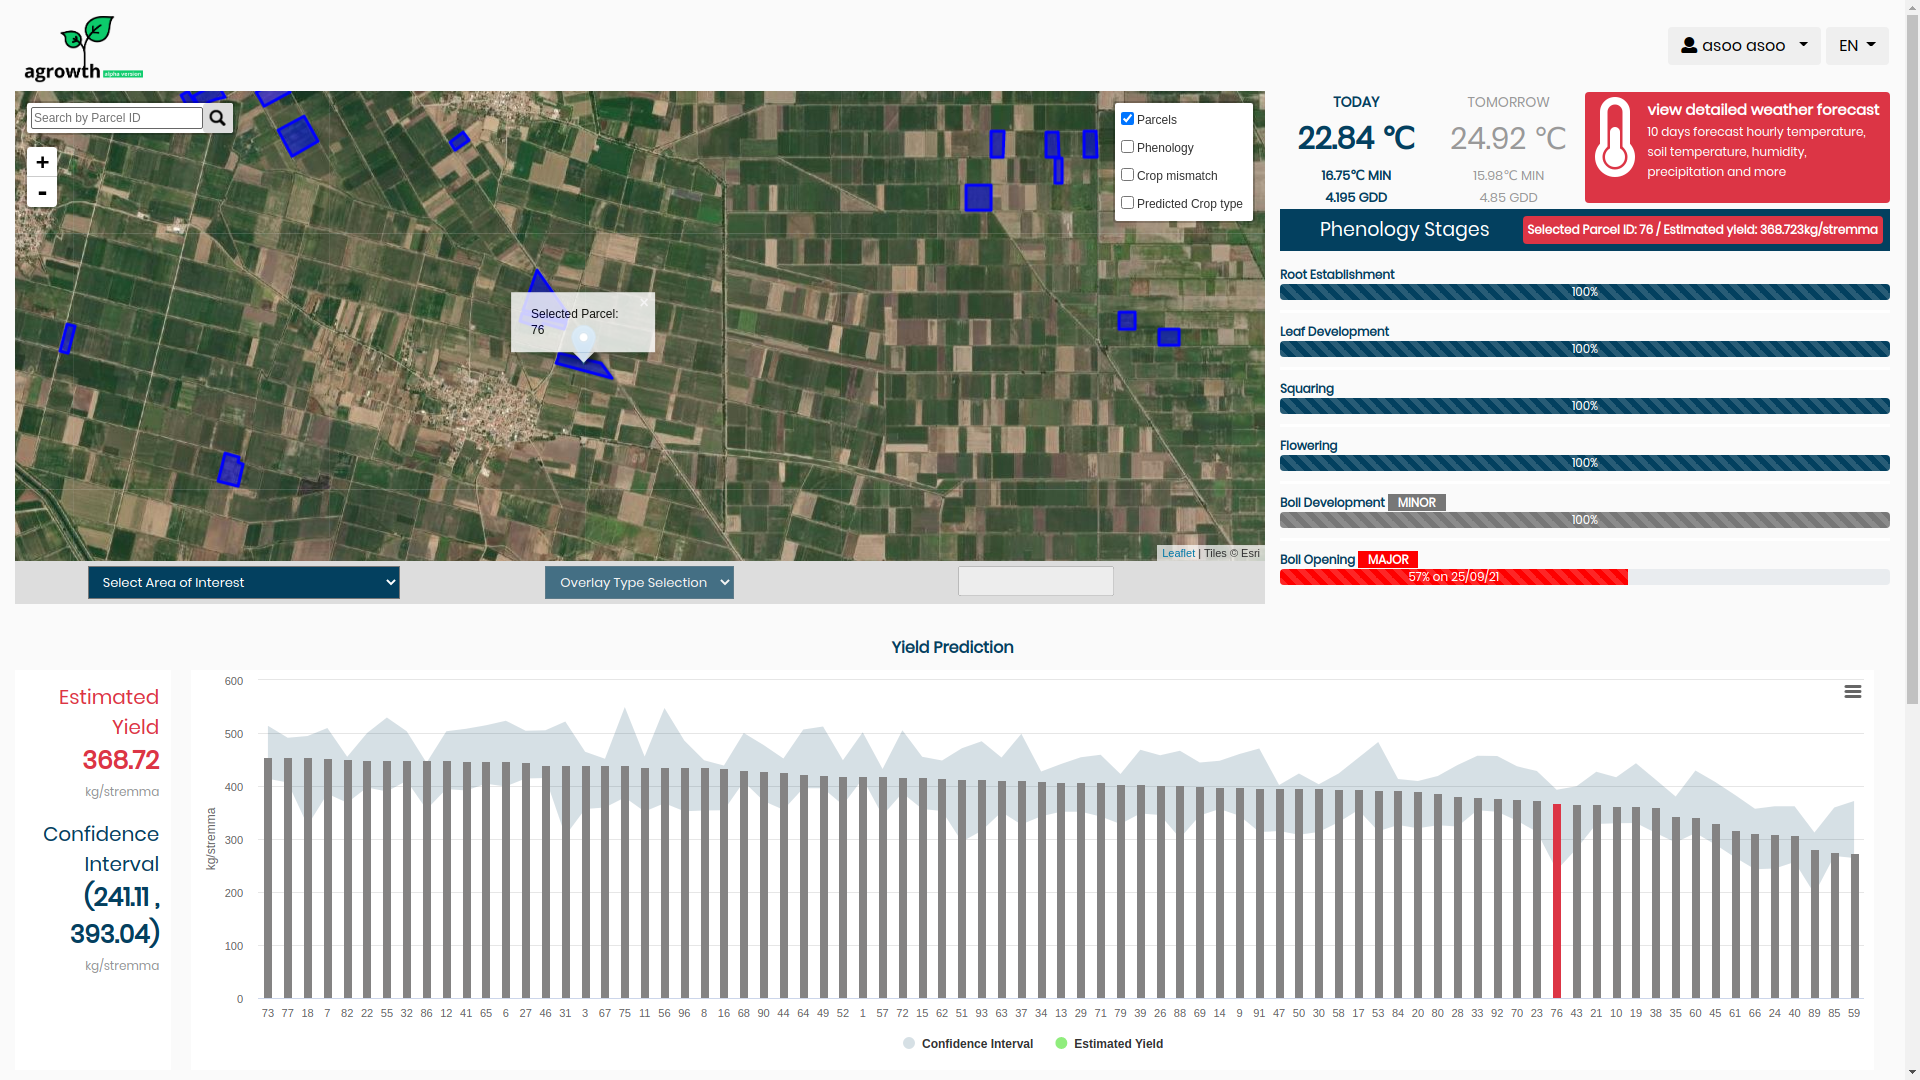
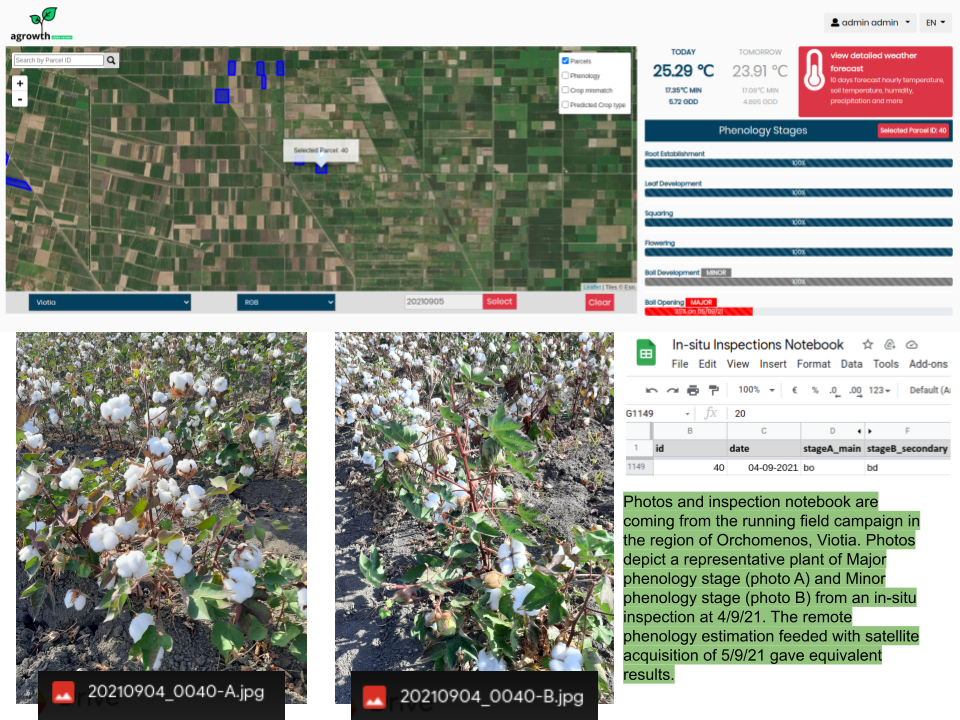
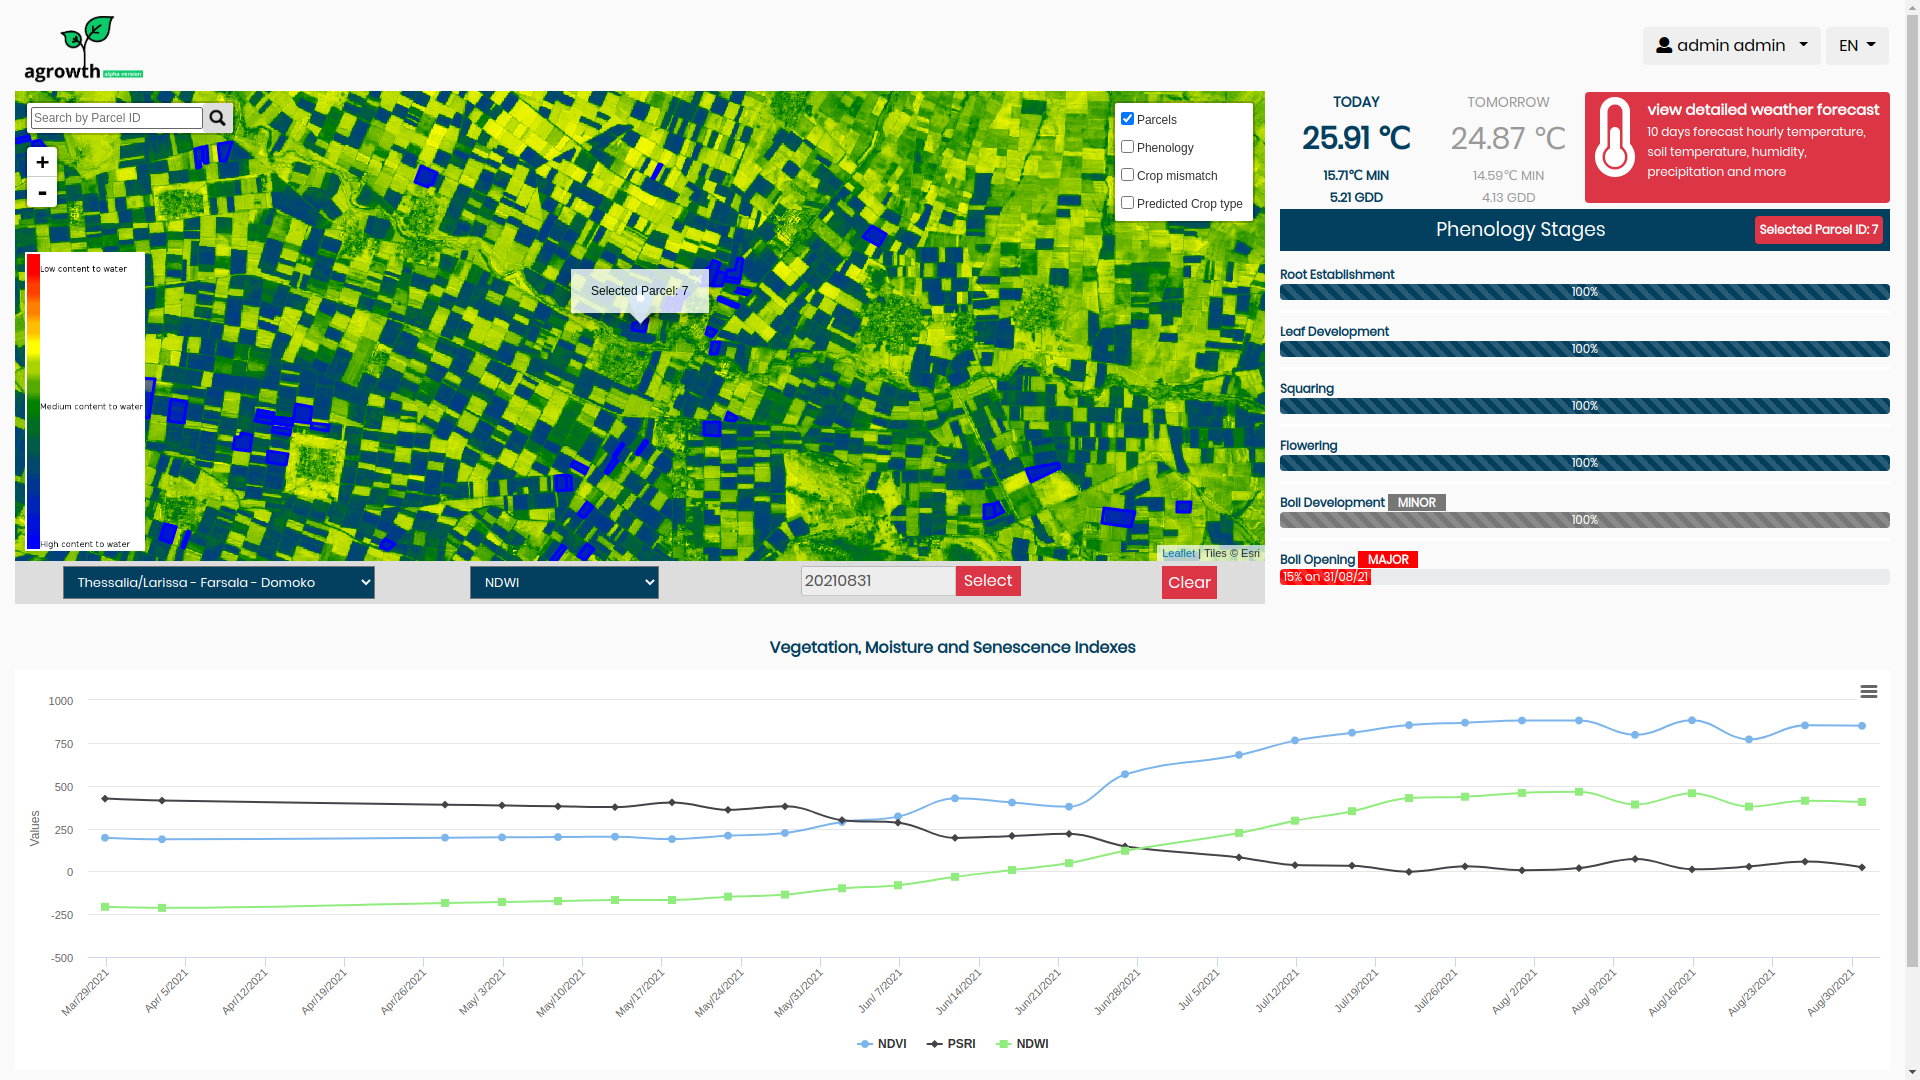
Agrowth platform combines Earth Observation data along with pertinent vegetation indices, soil and weather data. It makes use of state of the art in Artificial Intelligence in order to support smart farming using EO data. Specifically, it provides a crop monitoring service which offers information and/or actionable advice at the parcel level. In the current alpha version, the available services per parcel are:
Furthermore, there are some services for a quick overall view of the state of all available parcels on the map of user.
|
Testimony from CottonFarsala about daily sowing map
“Several farmers went on with sowing their parcels even though the sowing maps indicated otherwise. The conditions of the short future were unfavorable and the farmers had to sow for a second time a couple of weeks later.”
Vaggelis Georgolopoulos - Agronomist | Cotton Farsala
- "I need to know when is the best time for sowing”
- “I need to know when to apply pix (plant growth regulator) on my cotton fields”
- “I need to know my expected yield early in the year so I can take relevant action”
- “I need to know the occurrence of an imminent extreme weather event and the appropriate action I should take given the growth stage of my cultivation”
The main challenge observed it to "monitor and provide effective, timely and frequent consultation over large agricultural areas.”
The benefits of the Agrowth platform are the following:
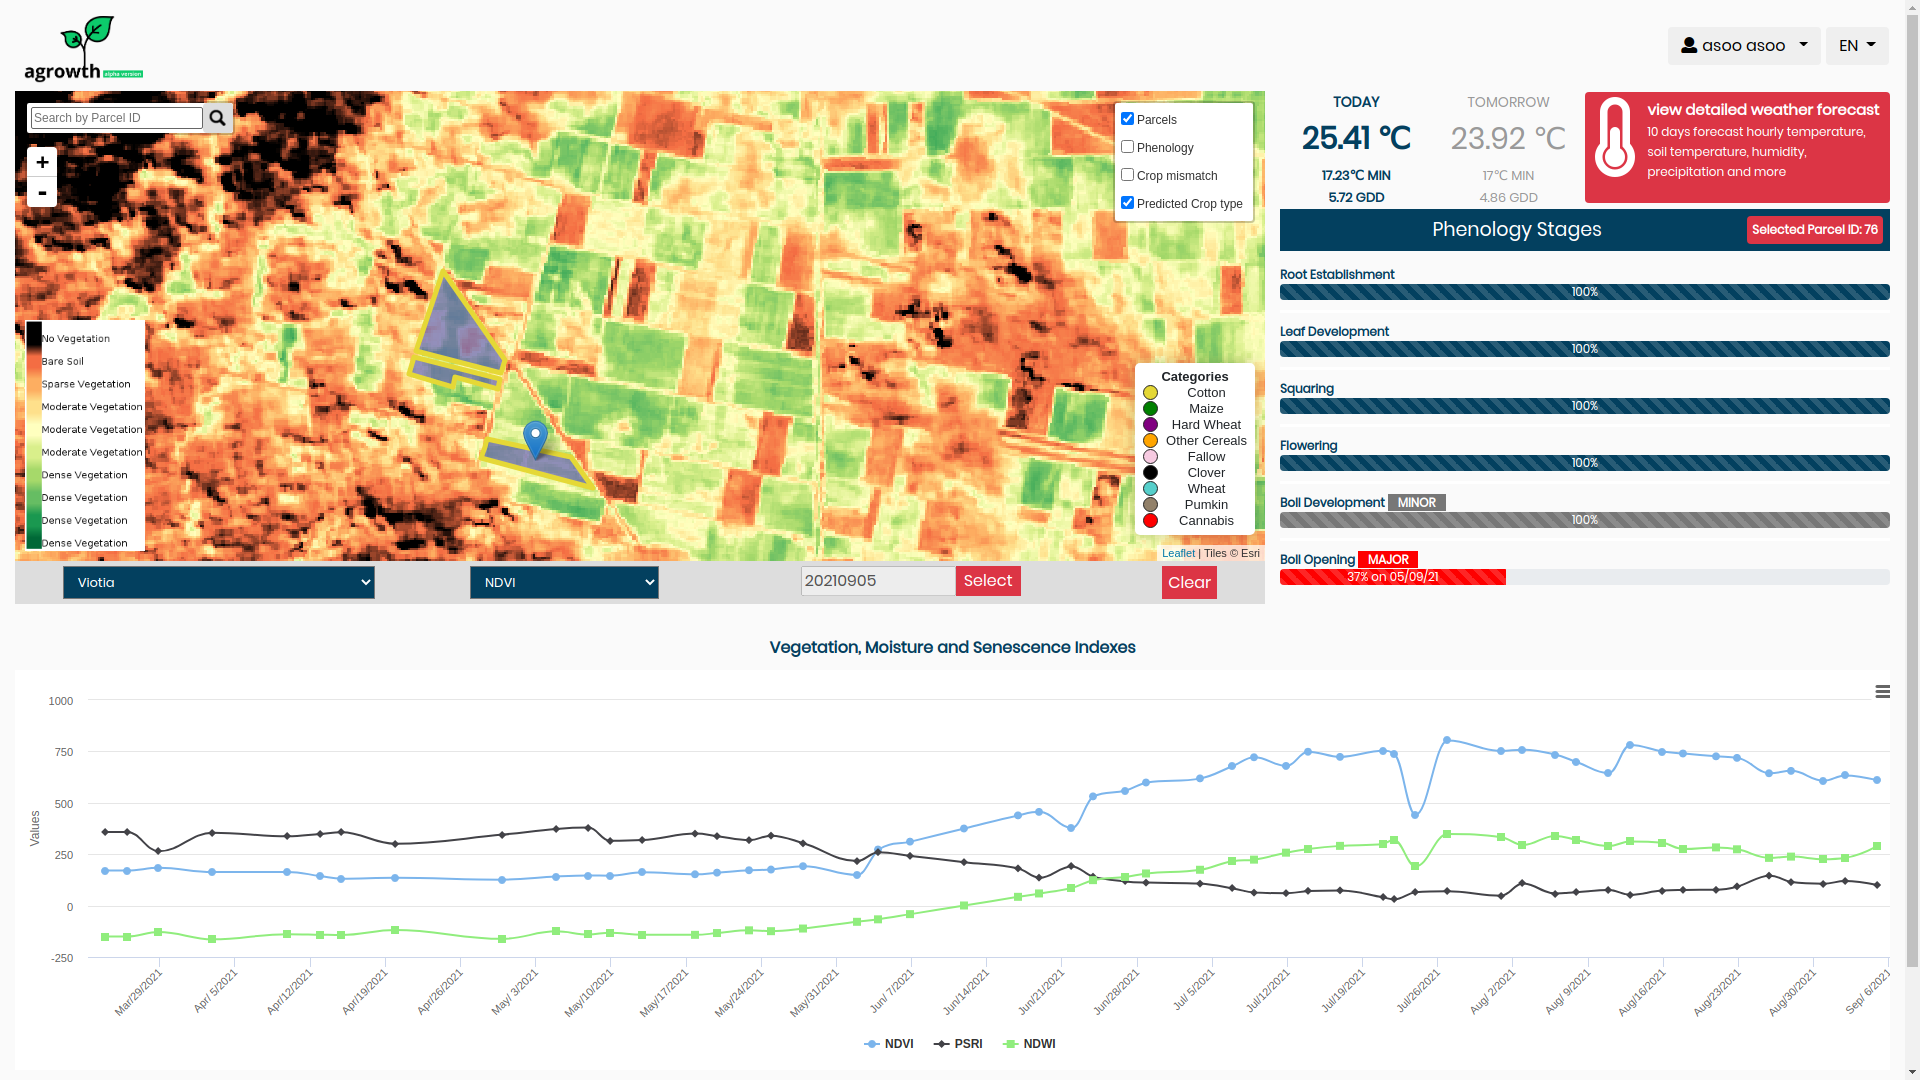
- It estimates the current phenology stage of crop and the fuzzy transition of them in the course of time. → Producer/Farmer knows every time in what stage his/her crop is and he/she is able to take action.
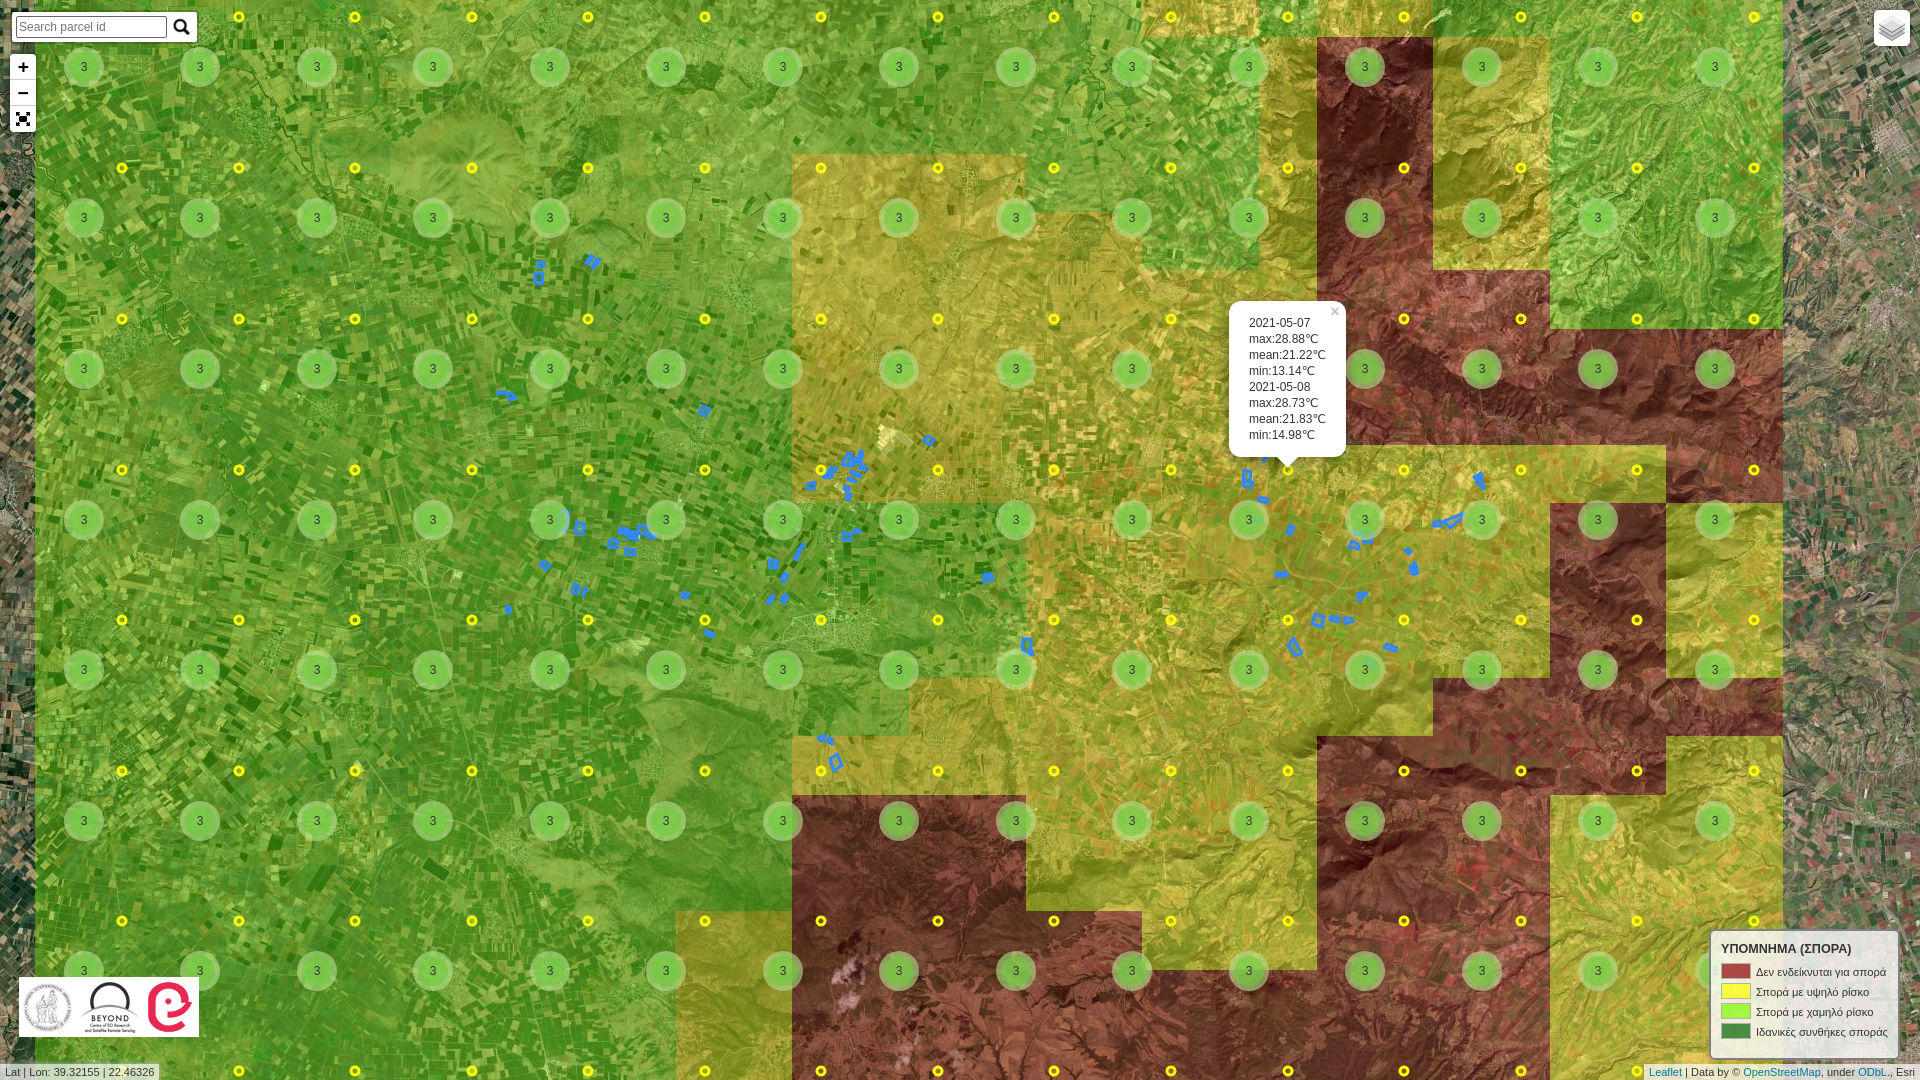
- It provides a heatmap for the sowing period of cotton which estimates daily the risk(high/medium/low) → Producer/Farmer has an indication about the right time of sowing, he/she is able to catch the possible sweet early window of April for cotton sowing.
- It predicts the yield in kg/ha, weeks earlier from the harvest. → Producer/Farmer has a good estimation of yield weeks earlier.
- It provides charts for the evolution of the vegetation indices NDVI, NDWI, PSRI and some crop specific indices. → Producer/Farmer has a good indication in order to monitor the vegetation health and the moisture of the crop.
- It visualizes the max and min ambient temperatures per parcel and it interplays with risk.resagri.eu. → Producer/Farmer has access to ResAgri’s detailed weather information in a 2km x 2km spatial resolution.
Learn more about the service: http://agrowth.beyond-eocenter.eu/
Learn more about e-shape: www.e-shape.eu
A question? Contact the Helpdesk: https://helpdesk.e-shape.eu
This page has no comments.