Product Description
Forested areas present challenges for wind resource assessment due to their likelihood to change and the difficulty in modelling wind flow. It can be difficult to accurately map the transitions between dense tree cover and open space. Forests change on short temporal scales due to growth and deforestation. The use of LiDAR for this sort of task is possible but comes at a cost and static land cover maps do not capture forest properties. Canopy height measurements can be used to improve roughness length measurements for wind resource assessments in forested areas. Depending on the resolution of the satellite data used, this can be at tree level or on a broader scale. Both optical and radar sensors can be used for this application and horizontal resolutions range from a few meters to approximately 20 m.
Satellite optical and radar sensors cannot directly measure canopy height and therefore require the use of ground truth data. This comes in the form of LiDAR such as that from NASA’s Global Ecosystem Dynamics Investigation (GEDI) and from the Ice, Cloud, and Land Elevation Satellite-2 (ICESat-2). Data such as this is too sparse to provide global canopy heights, but can act as a training and validation dataset for machine learning models that take satellite data as input.
Input Data Sources
• Sentinel-2, Sentinel-1, WorldView.
• Additional data sources:
• NASA GEDI full waveform LiDAR
- • Ice, Cloud, and Land Elevation Satellite-2 (ICESat-2)
- • Land cover maps
- • NASA Land, Vegetation and Ice Sensor (LVIS)
Required Processing
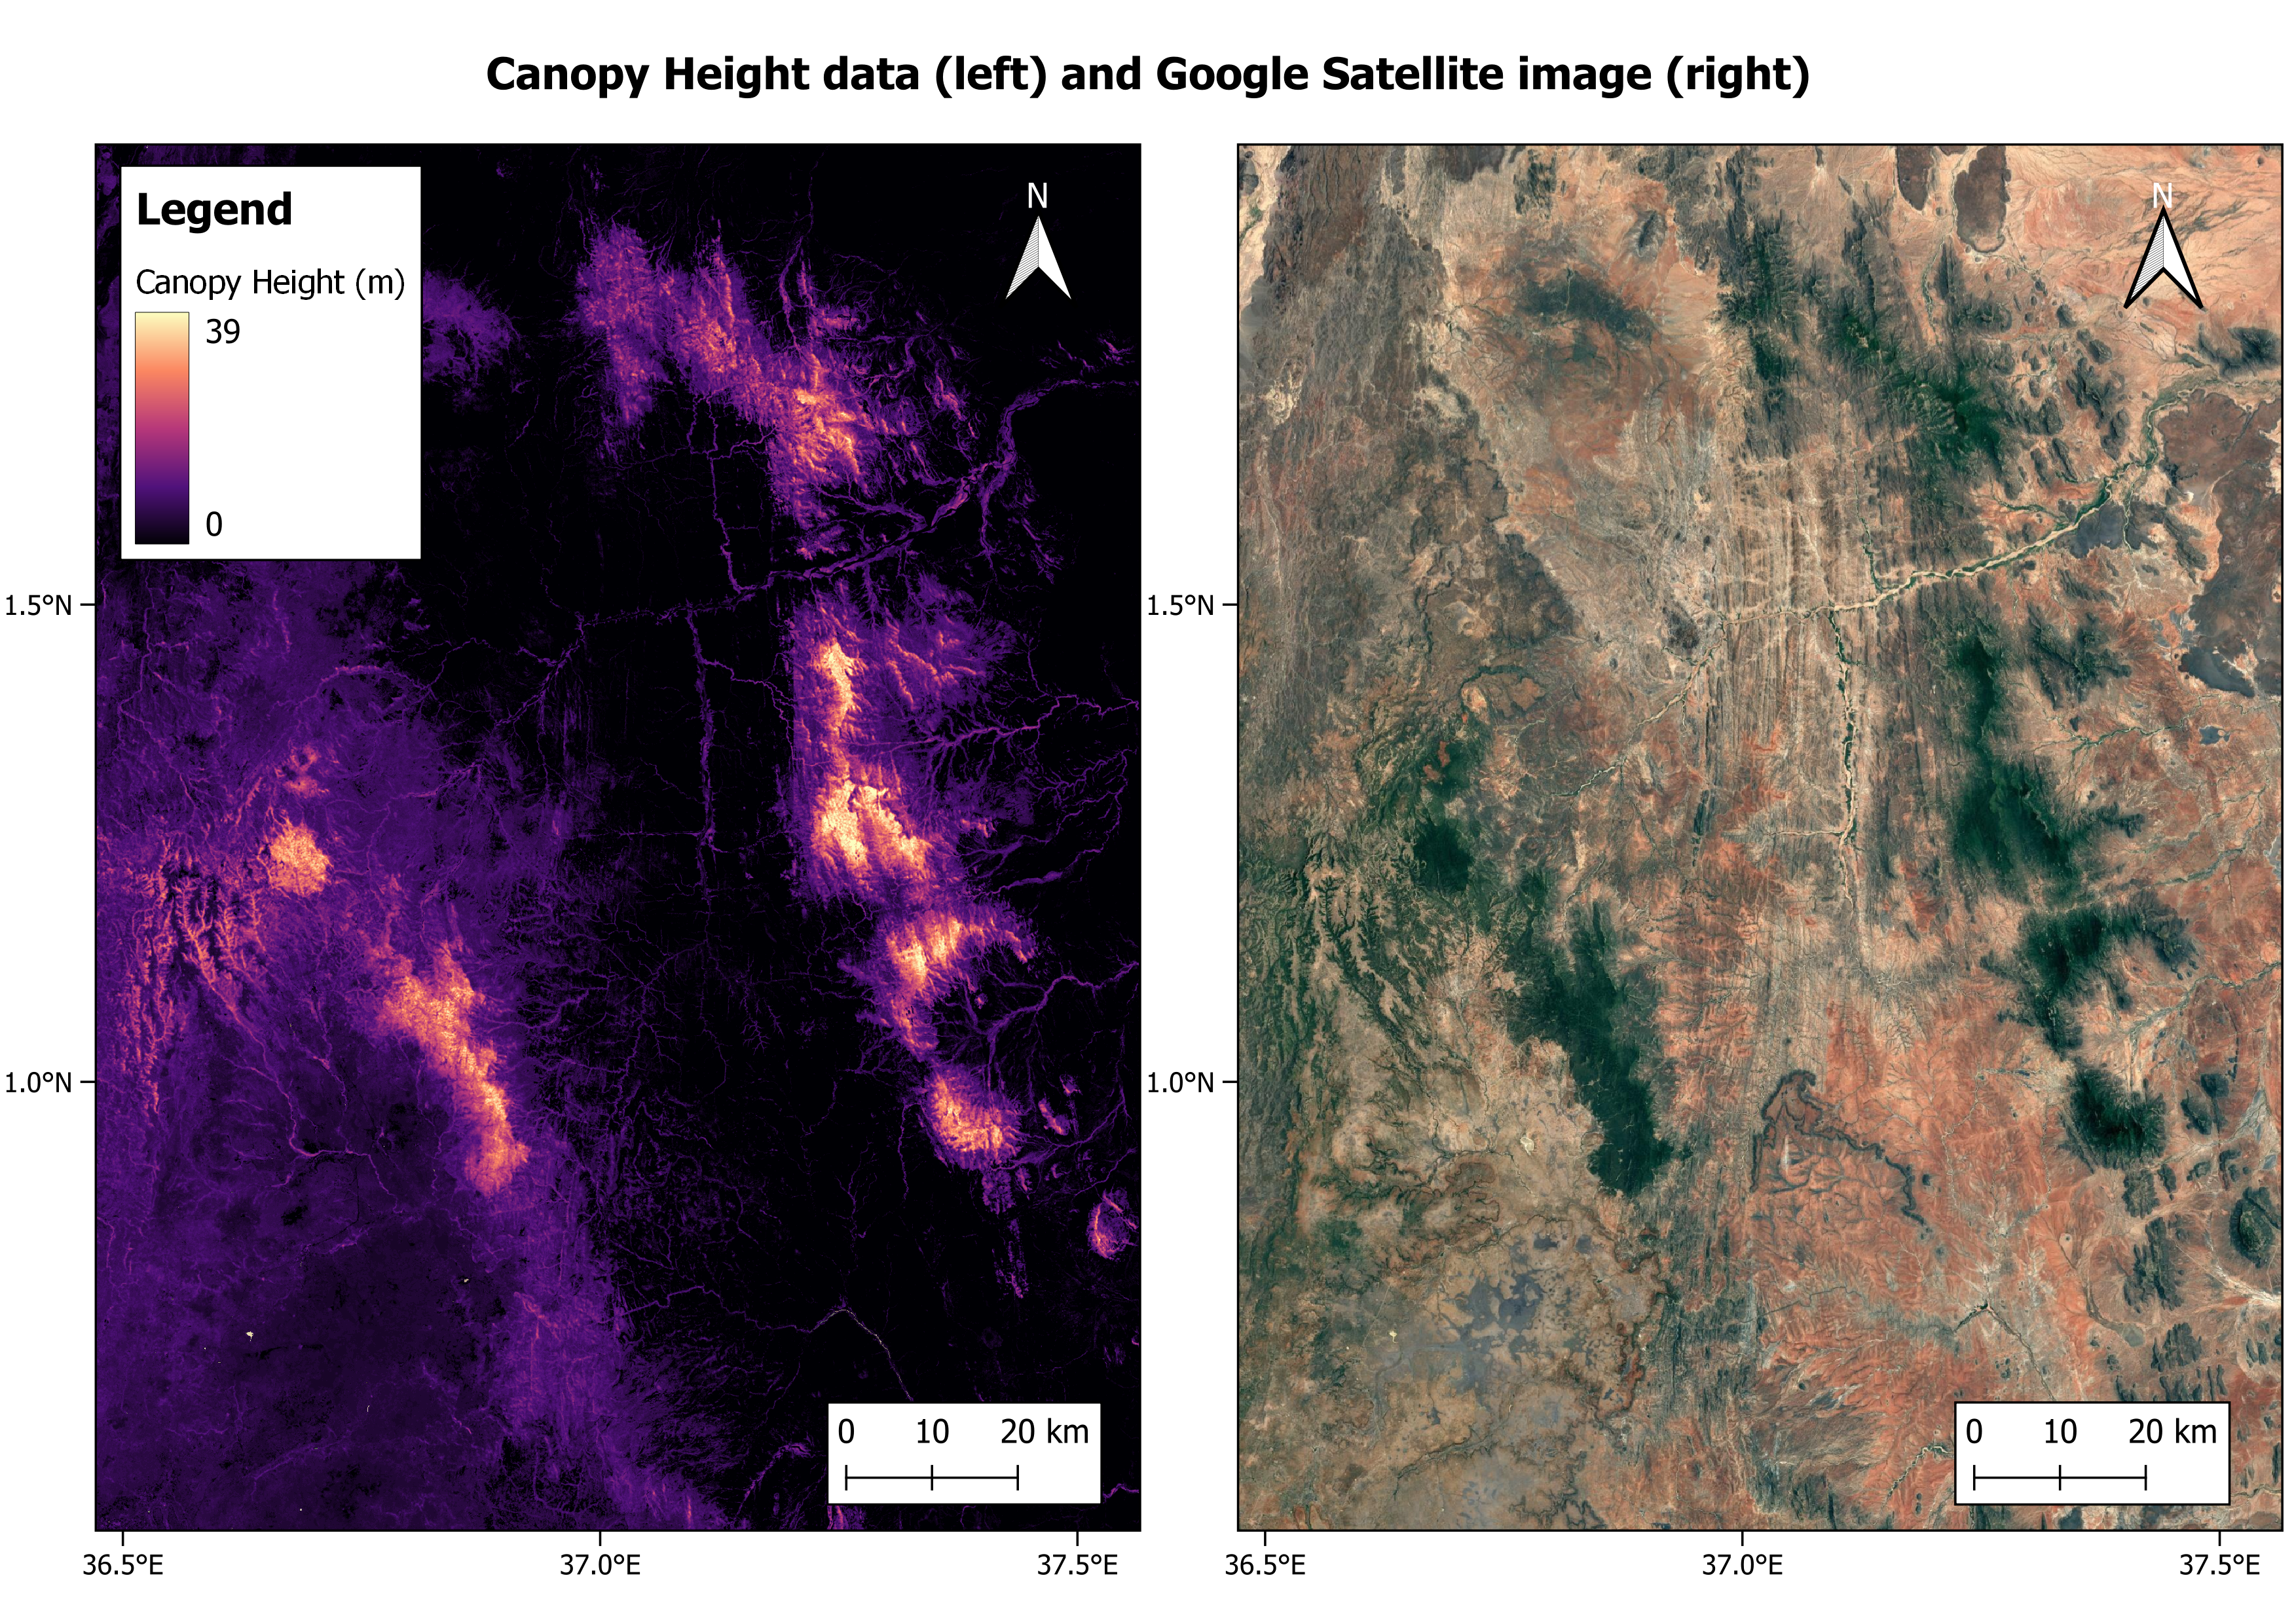
Satellite data tiles are collocated with LiDAR measurements for machine learning model training purposes. From optical data, red-edge contributions are known to be useful for canopy height determination, while the same can be said for backscatter coefficients from synthetic aperture radar data. Convolutional neural networks have been used with Sentinel-2 data in the past to create a global canopy height map for the year 2020 (see image above). In this case, all 12 bands and cyclically encoded coordinates were the model inputs. Datasets such as land cover maps are used to mask snow, ice, water bodies and built up areas.
Coverage and Frequency
• Coverage: Global
• Frequency:
• Sentinel-1: 6 – 12 days
• Sentinel-2: 6 days
• WorldView: 1 – 2 days
Resolutions
Resolution of the output depends on the input datasets and any resampling that has occured:
- • Sentinel-1: ~ 10 m
- • Sentinel-2 10 – 60 m
- • WorldView: ~ 2m
Accuracy and Validations
For the example of the data in the image above, the following metric were achieved when validated with GEDI data:
- • RMSE: 6.0 m
- • Bias: 1.3 m
Accuracy depends on the input data, the specific requirements of the client and the availability of training and validation data.
Limitations
• At high latitudes, the satellite repeat frequency is lower.
• The availability of training and validation data is location dependent.
Delivery Format
• GeoTIFF, other spatial data formats
• API
• User interface
Accessibility and Cost
Data accessibility and cost is dependent on the requirements of the client.
• There is a global canopy height map derived from Sentinel-2 data A Google Earth Engine app is available ( https://nlang.users.earthengine.app/view/global-canopy-height-2020) for data visualization. The data can be downloaded free of charge from the following link: https://libdrive.ethz.ch/index.php/s/cO8or7iOe5dT2Rt. The current best way to determine the correct tile for a particular area of interest is to use the ESA WorldCover map viewer tool at WorldCover Viewer. The tiles codes are equivalent and so can be matched. For example, the “ESA_WorldCover_10m_2020_v100_N00E036” product has the same extent as the “ETH_GlobalCanopyHeight_10m_2020_N00E036_Map” product.
This page has no comments.