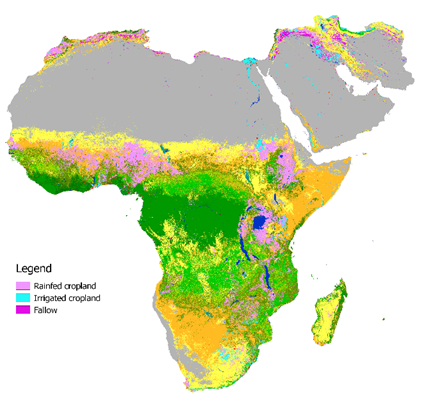
Land cover map over Africa and Near-East for 2015 at 250 m resolution, including distinction between irrigated and rainfed cropland (Source: VITO) | ||||||||||
Category | ||||||||||
PRODUCT DESCRIPTION | ||||||||||
Sustainable water management in agriculture is increasingly important to safeguard global food security, given the growing pressure on water resources worldwide exerted by climate change. In this respect, global and timely monitoring of water use and water productivity is urgently required. In particular, frequent and reliable information on the location and extent of irrigated areas could assist local governance to optimize water resource management. To date, this information is either produced at a limited, local scale in separate case studies, or derived from national statistics and hence characterized by high uncertainty. One exception is the global land cover map produced by ESA’s Climate Change Initiative1 from 1992 up to 2015, which includes information on irrigated versus rainfed cropland at 300 m resolution. As the methodology was not being designed for irrigation monitoring, accuracies are rather low. In response to this, FAO launched the WaPOR data portal2, specifically designed for large-scale crop water productivity assessment. Here, spatially explicit data on water availability and use are brought together, currently covering Africa and the Near-East. Ongoing research in this topic mainly focuses on improving accuracy in semi-arid regions (see below) and detection of irrigation events on individual fields using high-resolution data. 1 https://maps.elie.ucl.ac.be/CCI/viewer/ 2 https://wapor.apps.fao.org/home/WAPOR_2/1 | ||||||||||
PRODUCT SPECIFICATIONS | ||||||||||
Main processing stepsIrrigation mapping is accomplished by first detecting cropland and identifying growing seasons based on optical satellite observations. Next, using a water balance approach, in which observed rainfall quantities (input) are compared to modelled crop evapotranspiration (output), a distinction is made between irrigated and rainfed cropland. Cropland is classified as irrigated in case the crop water output cannot have been provided solely based on the available water from precipitation. The evapotranspiration is modelled using a combination of optical and thermal infrared satellite observations and weather data. All WaPOR products are available at 3 levels of spatial detail, i.e. 250 m (covering entire study area), 100 m (covering principal watersheds) and 30 m (for dedicated target areas). | ||||||||||
Input data sourcesOptical: MODIS (250 m), Proba-V (100 m) or Landsat (30 m), depending on desired spatial resolution Radar: n.a. Supporting data: CHIRPS rainfall data, Copernicus Global Land Cover dataset, weather data including, Land surface temperature data derived from thermal infrared imagery (MODIS or Landsat) | ||||||||||
Spatial resolution and coverageSpatial resolution: 250 m (also 100 m and 30 m products available for dedicated areas) Coverage: Africa and Near-East (see extent displayed in Figure above) Availability: Available on demand with service providers for regions with limited rainfall. | ||||||||||
Accuracy / constraintsThematic accuracy: The WaPOR methodology described above has shown particularly good performance of detecting irrigated areas in arid climatic conditions. In semi-arid regions however, where irrigation is only applied supplementary to overcome occasional periods of drought, distinction between rainfed and irrigated agriculture is less straightforward and requires a more dedicated methodology based on high-resolution input data and machine learning. At present, this is still an active field of research. Spatial accuracy: depending on resolution of input data and desired product | ||||||||||
LimitationsCurrent methodologies are mainly focused on regions with limited rainfall. | ||||||||||
Frequency / timelinessFrequency: updated yearly (available for 2009 – present) Timeliness: each year released after final growing season | ||||||||||
Delivery / output formatData type: Numerical land cover classification (integers) File format: GeoTIFF | ||||||||||
AccessibilityLarge-scale irrigation mapping (area based) in semi-arid and arid regions (WaPOR) The mapping of agricultural practices at field level is being tested in project such as SEN4CAP Available on demand with service providers for regions with limited rainfall. | ||||||||||
CHALLENGES ADDRESSED - USE CASE(S) | ||||||||||
Product Development:
Product Sales:
Underwriting:
Claims Handling: | ||||||||||

Overview
Community Forums
Content Tools
This page has no comments.