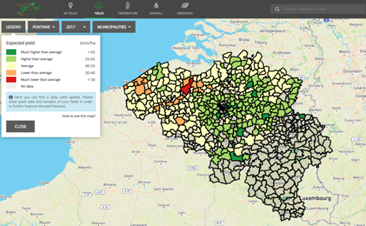
Example Image (watchitgrow.be) | ||||||||||
Category | ||||||||||
PRODUCT DESCRIPTION | ||||||||||
Earth observation based detection of anomalies in vegetation growth is being done by benchmarking recent observations of vegetation indices against expected or similar situations. The scale of detection and landscape dynamics determines what could be used as benchmark. For annual crops, anomaly detection cannot rely on a long term comparison due to crop rotation. Furthermore, crops are often grown on small fields of which the boundaries may change over time. Anomaly detection is crop-specific but in a rotation scheme the crop type will change from one year to the another. Because of the changing boundaries and crop types, anomaly detection for annual crops rather focuses on comparing vegetation index values of a field with values of similar fields in the region, i.e. fields where the same crop is grown, fields with similar planting dates,... Due to the small field size high resolution satellite data are required which have a shorter archive (in the case of Sentinel-2 since 2016) which limits the historical benchmarking. Regional benchmarking can be done in two ways:
Within a season anomalies can be detected by inter-comparing ongoing growth conditions of a field with growth conditions of fields in the vicinity. At field (polygon) level, the temporal evolution of the actual vegetation index is compared with the evolution of the index at neighbouring fields where the same crop is grown.
For annual crops, a crop type specific database of historical benchmark profiles of vegetation indices (at regional level) can be generated since 2016 and could be operated in near real time. Anomalous crop growth can be detected by comparing actual crop growth parameters for a field (polygon) with similar situations based on these historical observations. Extreme seasons or fields performing better or worse compared to what is expected or what was observed in previous years can easily be highlighted by comparing their profiles to the relevant benchmark. Automatic warnings can be generated and sent to the field owner so that necessary actions can be taken. Information on anomalies can also be interesting for insurance companies, to check where and to what extent damages occur. | ||||||||||
PRODUCT SPECIFICATIONS | ||||||||||
Main processing stepsGeneration of cloud free time series of vegetation indices at parcel level and statistics for inter-comparison analyses. | ||||||||||
Input data sourcesOptical: Sentinel-2 Radar: n.a.Supporting data: in-situ information on crop production, meteo data | ||||||||||
Spatial resolution and coverageSpatial resolution: 10m Coverage: Farm level till Watershed scale Availability: globally available | ||||||||||
Accuracy / constraintsThematic accuracy: Earth observation based anomaly detection is indicating a benchmark against similar information and hence does not represent a physical property of the vegetation. Assessment of the quality can therefore not be absolutely determined but rather relies on the quality of the input data, convergence of evidence (e.g. weather anomalies) and the relation with information collected at site (e.g. biomass measurements, yields, crop damage reports). Spatial accuracy: field level | ||||||||||
LimitationsHeterogeneity within a crop type may be caused by several factors such as crop type variety, soil characteristics, crop management and hence not always reflects crop production differences. | ||||||||||
Frequency / timelinessFrequency: daily Timeliness: near real-time | ||||||||||
Delivery / output formatData type: Different formats are possible, e.g. time series of anomalies, or ranking of fields. File format: parcel level aggregated values (e.g. CSV) | ||||||||||
AccessibilityCommercially available on demand from EO service providers. | ||||||||||
CHALLENGES ADDRESSED - USE CASE(S) | ||||||||||
Product Development:
Underwriting:
Loss Adjustment:
Claims Handling:
| ||||||||||

Overview
Community Forums
Content Tools
This page has no comments.