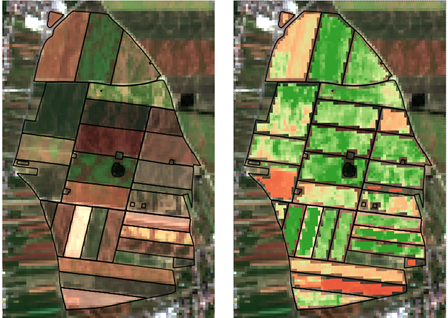
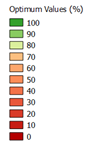
Performance of crop fields (Source: GeoVille) | ||||||||||
Category | ||||||||||
|
|
|
|
| ||||||
PRODUCT DESCRIPTION | ||||||||||
This service provides information on vegetation stress based on long time series of optical satellite data. Information on a long-time scale and range of spatial scales can be derived. Vegetation trend observation can be a helpful tool of where to focus further investigations, potentially as the basis for possible interventions. Vegetation stress is derived based on different methodologies. Most of them use vegetation indices such as the Normalized Differenced Vegetation Index (NDVI), Leaf Area Index (LAI) or Fraction of Absorbed Photosynthetically Active Radiation (FAPAR). A long and consistent time series of satellite data is required to separate short term from long term vegetation stress. Additional data such as meteorological data is furthermore needed to distinguish between weather-induced short-term changes and long-term stress caused by other factors (e.g.: farm management, inputs application, soil specifics, etc.) | ||||||||||
PRODUCT SPECIFICATIONS | ||||||||||
Main processing stepsProcessing is based on long and consistent time series of vegetation indices. | ||||||||||
Input data sourcesOptical: Sentinel-2 Radar: Sentinel-1 Supporting data: meteorological data | ||||||||||
Spatial resolution and coverageSpatial resolution: 10 – 300 m Coverage: National/regional/local level Availability: globally available | ||||||||||
Accuracy / constraintsThematic accuracy: > 85 %, depending on in-situ data availability Spatial accuracy: 1.5 - 2 pixels of input data | ||||||||||
LimitationsTo disentangle actual stress from normal but e.g. delayed vegetation growth or mismanagement requires not only long time series but also information about natural conditions such as rainfall deficits. | ||||||||||
Frequency / timelinessFrequency: depending on satellite revisit rates Timeliness: near real-time | ||||||||||
Delivery / output formatData type: Raster formats, vector formats File format: GeoTIFF, shapefile | ||||||||||
AccessibilityCommercially available on demand from EO service providers. | ||||||||||
CHALLENGES ADDRESSED - USE CASE(S) | ||||||||||
Underwriting:
Loss Adjustment:
| ||||||||||

Overview
Community Forums
Content Tools
This page has no comments.