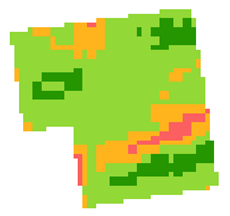
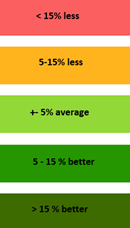
Historical crop growth zone detection based on 5 years of Sentinel-2 data for a parcel in Belgium (Source: VITO, watchitgrow.be) | ||||||||||
Category | ||||||||||
|
|
|
|
| ||||||
PRODUCT DESCRIPTION | ||||||||||
A crop parcel is mostly uniformly treated by farmers and local weather conditions. Many fields however show a spatial variability in crop performance in the course of the growing season. Such variability is caused by a variety of natural and technology factors. Where a multiyear recurrent variability is caused by differences in soil types, topography, weather micro-zones, crop growing technologies applied by the farmer, level of precipitation and irrigation access, while more abrupt and unexpected field variability could be caused by extreme weather events (e.g.: hail, storm, flood, drought, etc.). Availability of crop growth zones is important for all stages of insurance product cycle, while the highest importance of such information is for agricultural underwriting and loss adjustment. | ||||||||||
PRODUCT SPECIFICATIONS | ||||||||||
Main processing stepsSatellite information derived from Sentinel-2 can support the evaluation of historical natural field variability as compared to the near real time detection of less/better performing zones within crop parcels. | ||||||||||
Input data sourcesOptical: Sentinel-2 Radar: n.a. Supporting data: for development: field yield samples | ||||||||||
Spatial resolution and coverageSpatial resolution: 10 m Coverage: crop parcel Availability: On demand | ||||||||||
Accuracy / constraintsThematic accuracy: The maps do not represent a physical quantity hence only a qualitative assessment is possible, e.g. by relating the maps with intra-field yield variability, detailed soil maps or crop damage maps. It is advised to perform an assessment with the service provider on a study area to evaluate the quality of the maps for a specific usage and region. Spatial accuracy: See Thematic accuracy. | ||||||||||
LimitationsChallenging to detect the underlying processes of the intra-field variability: e.g. soil, agricultural management, crop damage. Ancillary information on weather conditions and crop type are required to interpret the detected crop growth zones. | ||||||||||
Frequency / timelinessFrequency: static maps or updated regularly (+- weekly) Timeliness: historical data or < 2 weeks | ||||||||||
Delivery / output formatData type: raster, vector File format: GeoTIFF, Shapefile | ||||||||||
AccessibilityAvailable on demand from EO service providers. | ||||||||||
CHALLENGES ADDRESSED - USE CASE(S) | ||||||||||
Product Development:
Product Sales
Underwriting:
Loss Adjustment:
Claims Handling:
| ||||||||||

Overview
Community Forums
Content Tools
This page has no comments.