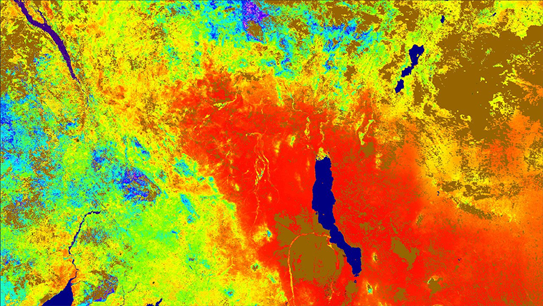
Terra MODIS evapotranspiration (ET) data from the MOD16A2 product over east Africa from August 13 - 20, 2018 (Source: USGS) | ||||||||||
Category | ||||||||||
|
|
|
|
| ||||||
PRODUCT DESCRIPTION | ||||||||||
| Evapotranspiration quantifies the amount of water used in the plant production process. EO products show the terrestrial evapotranspiration from earth land surface that can be used to assess regional water and energy balance as well as the soil water status. Evapotranspiration is the sum of soil evaporation, canopy transpiration and interception. The sum of these three parameters quantifies the amount of water consumed by agricultural use. | ||||||||||
PRODUCT SPECIFICATIONS | ||||||||||
Main processing stepsInformation on evapotranspiration uses Earth observation satellite data combined with several other data and indicators. Derived information is based on indicators such as soil moisture information and several vegetation indices such as the Normalized Difference Vegetation Index (NDVI), Leaf Area Index (LAI), Fraction of Vegetation Cover (FVC). Also, meteorological data and indicators are used such as solar radiation, air temperature, vapour pressure, wind speed and precipitation. These data are combined and modelled to derive actual and potential evapotranspiration. | ||||||||||
Input data sourcesOptical: MODIS, Meteosat Radar: n.a. Supporting data: meteorological data | ||||||||||
Spatial resolution and coverageSpatial resolution: 250 m – 1 km Coverage: global Availability: globally available | ||||||||||
Accuracy / constraintsProduct accuracy has been estimated using a small number of independent measurements obtained from selected locations and time periods and ground-truth/field program effort. The pixel level quality control layer (ET_QC_500m) is a copy of the quality control data layer of the corresponding input LAI/FPAR (MOD15A2H) granule of the same 8-day composite period and does not reflect the quality of the retrieved evapotranspiration. The current operational process does not generate pixel level science quality information. Users are advised to exercise caution while using the product in their application. https://lpdaac.usgs.gov/products/mod16a2v006/ | ||||||||||
LimitationsA large number of physical factors are involved in soil surface evaporation and plant transpiration processes, including microclimate, plant biophysics for site specific species and landscape heterogeneity, making accurate assessment of ET a challenge. | ||||||||||
Frequency / timelinessFrequency: daily Timeliness: near real-time | ||||||||||
Delivery / output formatData type: raster File format: GeoTIFF | ||||||||||
AccessibilityProducts derived from MODIS satellite data are freely accessible (https://lpdaac.usgs.gov/products/mod16a2v006/). Data for Africa can be accessed through an FAO data portal (https://wapor.apps.fao.org/catalog/WAPOR_2/1). | ||||||||||
CHALLENGES ADDRESSED - USE CASE(S) | ||||||||||
Product development:
Product Sales:
Underwriting:
Loss Adjustment:
Claims handling:
| ||||||||||

Overview
Community Forums
Content Tools
This page has no comments.