Assess changes in the carbon balance| Section |
|---|
| Column |
|---|
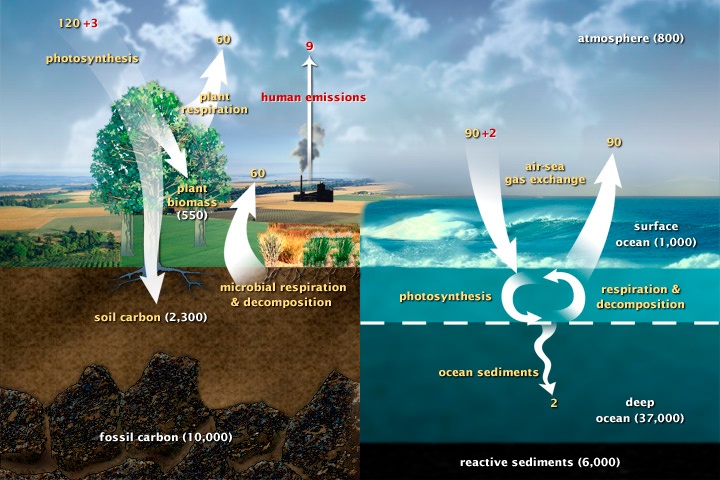
| The carbon balance refers to the exchanges of carbon between carbon reservoirs (sources or sinks for carbon dioxide) of our planet, or during specific loops of the carbon cycle. This cycle is the bio-geochemical cycle by which carbon is exchanged among biosphere, pedosphere, geosphere, hydrosphere and atmosphere of the Earth, and it is crucial for ecosystems well-being and climate functioning. |
| Column |
|---|
| 
The fast carbon cycle comprises the movement of carbon between land, atmosphere, and oceans (here shown in billions of tons of carbon per year). Yellow numbers are natural fluxes, red are human contributions, while white ones indicate stored carbon. © NASA |
|
As described in the last report from the Intergovernmental Panel on Climate Change, greenhouse gases emissions have uncreased for the last four decades (1970-2010), registering the highest decadal increases towards the end of the period under screening. Economic and population growth continue to increase carbon dioxide (CO2)emissions from fossil fuels (e.g. coal, oil and gas) combustion. Among the main drivers of climate change, total radiative forcing positive trend has been identified as having led to an uptake of energy by the climate system, and concentration of carbon dioxide increase since 1750 has been the largest contribution to total radiative forcing (1). Measuring greenhouse gases, especially CO2 and methan, let scientists assess changes in the carbon balance. This is very importanto both to understand and scientifically demonstrate climate change and its drivers, to improve climate prediction, and to monitor mitigation strategies results. Measurements from ESA’s Envisat mission and Japan’s Greenhouse gases Observing Satellite, GOSAT, show that carbon dioxide increased by about 0.5% every year between 2003 and 2013. After years of stability, methane began increasing by 0.3–0.5% per year from 2007 on (2). In addition to the increase in greenhouse gases, the satellites also show many other features such as the gases’ detailed geographical pattern and fluctuations with time. For carbon dioxide, seasonal fluctuations are the largest, caused by variations in the photosynthesis of vegetation. The observed ‘breathing’ is largest in northern mid to high latitudes. This is expected since there the carbon exchange between the atmosphere and vegetation is particularly large, with forests sequestering carbon during the summer (‘inhaling’), part of which is released during winter (‘exhaling’) (2). | Section |
|---|
| Column |
|---|
| On the US side, NASA just recenly launched the OCO-2 mission, especially dedicated to the study of carbon dioxide. Global efforts in satellite measurement and assessment of carbon balance make it clear how important this task is considered. One of the main advantages of satellite measurement is the possibility of having continuous, repeated and spatially wide measurement which prove to be very useful to identify and follow greenhouse gases concentration and trends. Together with direct measurement of CO2 concentration, the carbon balance is also monitored by satellites measuring vegetation and biomass parameters, oceans ones, and human environment changes, being them all factors related to the carbon cycle. |
|
References (1) IPCC, Climate Change 2013: The Physical Science Basis (2) http://www.esa.int/Our_Activities/Observing_the_Earth/Space_for_our_climate/Our_living_planet_Earth_s_carbon_dioxide_breathing_seen_from_space |