| Needs | EO Services |
|---|
Agriculture | Agricultural commodities/trading,
agricultural production / horticulture,
agricultural services,
agriculture machinery,
agriculture and rural development policy,
agri chemicals / plants & fertilizers,
animal production / livestock/ stock traders on commodity price like wheat, coffee. The EO/GI users also include agriculture and rural policy makers and insurers. |
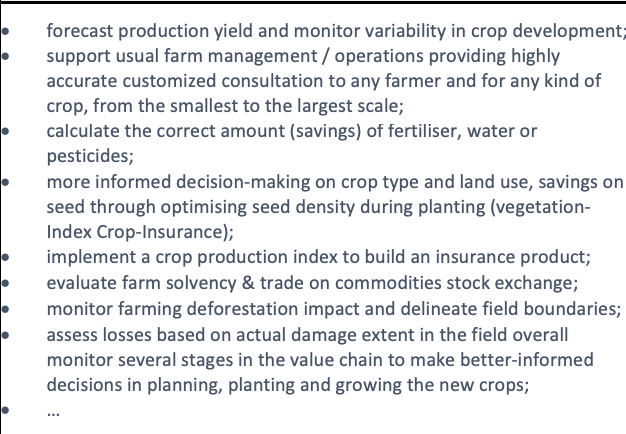 Image Removedimprove fisheries economic activity boosting their income, making the fishing experience easier, safer, and more sustainable, assessing fish shoals, catch optimisation & understanding the impact, overfishing, livestock monitoring/management, etc; detect patterns of illegal behaviour at sea (illegal fishing, narco-traffic, immigration, maritime pollution, piracy);establish historical forest area changes and implement forest monitoring solutions;verify the impact of and compliance with no-deforestation policies and transform the industry towards sustainable practices (sustainable management of forest); set-up reducing emissions from deforestation and forest degradation (REDD+ national strategy and support final users in obtaining certificates and carbon credits) (REDD+ MRV (monitoring, reporting and verification));perform cost-effective and accurate forest inventory, at national or local scales; conservation and enhancement of forest carbon stocks, baseline mapping and stock change; damage assessment; Image Removedimprove fisheries economic activity boosting their income, making the fishing experience easier, safer, and more sustainable, assessing fish shoals, catch optimisation & understanding the impact, overfishing, livestock monitoring/management, etc; detect patterns of illegal behaviour at sea (illegal fishing, narco-traffic, immigration, maritime pollution, piracy);establish historical forest area changes and implement forest monitoring solutions;verify the impact of and compliance with no-deforestation policies and transform the industry towards sustainable practices (sustainable management of forest); set-up reducing emissions from deforestation and forest degradation (REDD+ national strategy and support final users in obtaining certificates and carbon credits) (REDD+ MRV (monitoring, reporting and verification));perform cost-effective and accurate forest inventory, at national or local scales; conservation and enhancement of forest carbon stocks, baseline mapping and stock change; damage assessment;
|