DynaCrop is integrating EO to digital farming for higher yields, easier decisions, and more joy of farming. It harnesses power of EO to foster the data-driven change across the food value chain. DynaCrop is a white-label ecosystem enabling companies in food value chain to use advanced information, statistics and intelligence based on EO. It provides ready-made crop monitoring, field statistics, application maps and soil moisture assessment on a global scale. Information is delivered through value-added platform (API, white label web application, QGIS plugin) and client is receiving sales support, user-centric consulting and R&D cooperation as part of the cooperation. Instead of building another solution for farmers, DynaCrop pursues a synergy with companies already established in the food value chain and help them to integrate EO-based information at scale. In this way, it minimizes resources needed for EO integration (money, time, human resources) and provide clients with state-of-the art service and consulting at low costs. Agrowth platform combines Earth Observation data along with pertinent vegetation indices, soil and weather data. It makes use of state of the art in Artificial Intelligence in order to support smart farming using EO data. Specifically, it provides a crop monitoring service which offers information and/or actionable advice at the parcel level. In the current alpha version, the available services per parcel are: - Phenology estimation: It estimates the current phenology stage of crop and the fuzzy transition of them in the course of time. Specifically, it provides the percentage of completion of each stage and it indicates the major and minor phenological stage in order to highlight this fuzziness of transition between of them.
- Weather Forecast: It visualizes the max and min ambient temperatures per parcel and it interplays with risk.resagri.eu. The user can be transferred at the click to ResAgri’s detailed weather information.
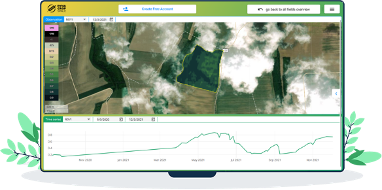
- Yield prediction: It predicts the yield in kg/ha, weeks earlier from the harvest.
- Vegetation Indices: It provides charts for the evolution of the vegetation indices NDVI, NDWI, PSRI and some crop specific indices.
Furthermore, there are some services for a quick overall view of the state of all available parcels on the map of user. - Overlay Satellite Images: It allows to overlay satellite images (RGB or NDVI) over the users’ parcels for a chosen acquisition date and area of interest.
- Phenology Stage: It colors the outline of each parcel with a color equivalent to its major phenology stage.
- Crop Classification: It colors the outline of each parcel with a color equivalent to its crop.
- Daily sowing map: It provides a heatmap for the sowing period of cotton which estimates daily the risk of sowing in a 2km x 2km spatial grid.
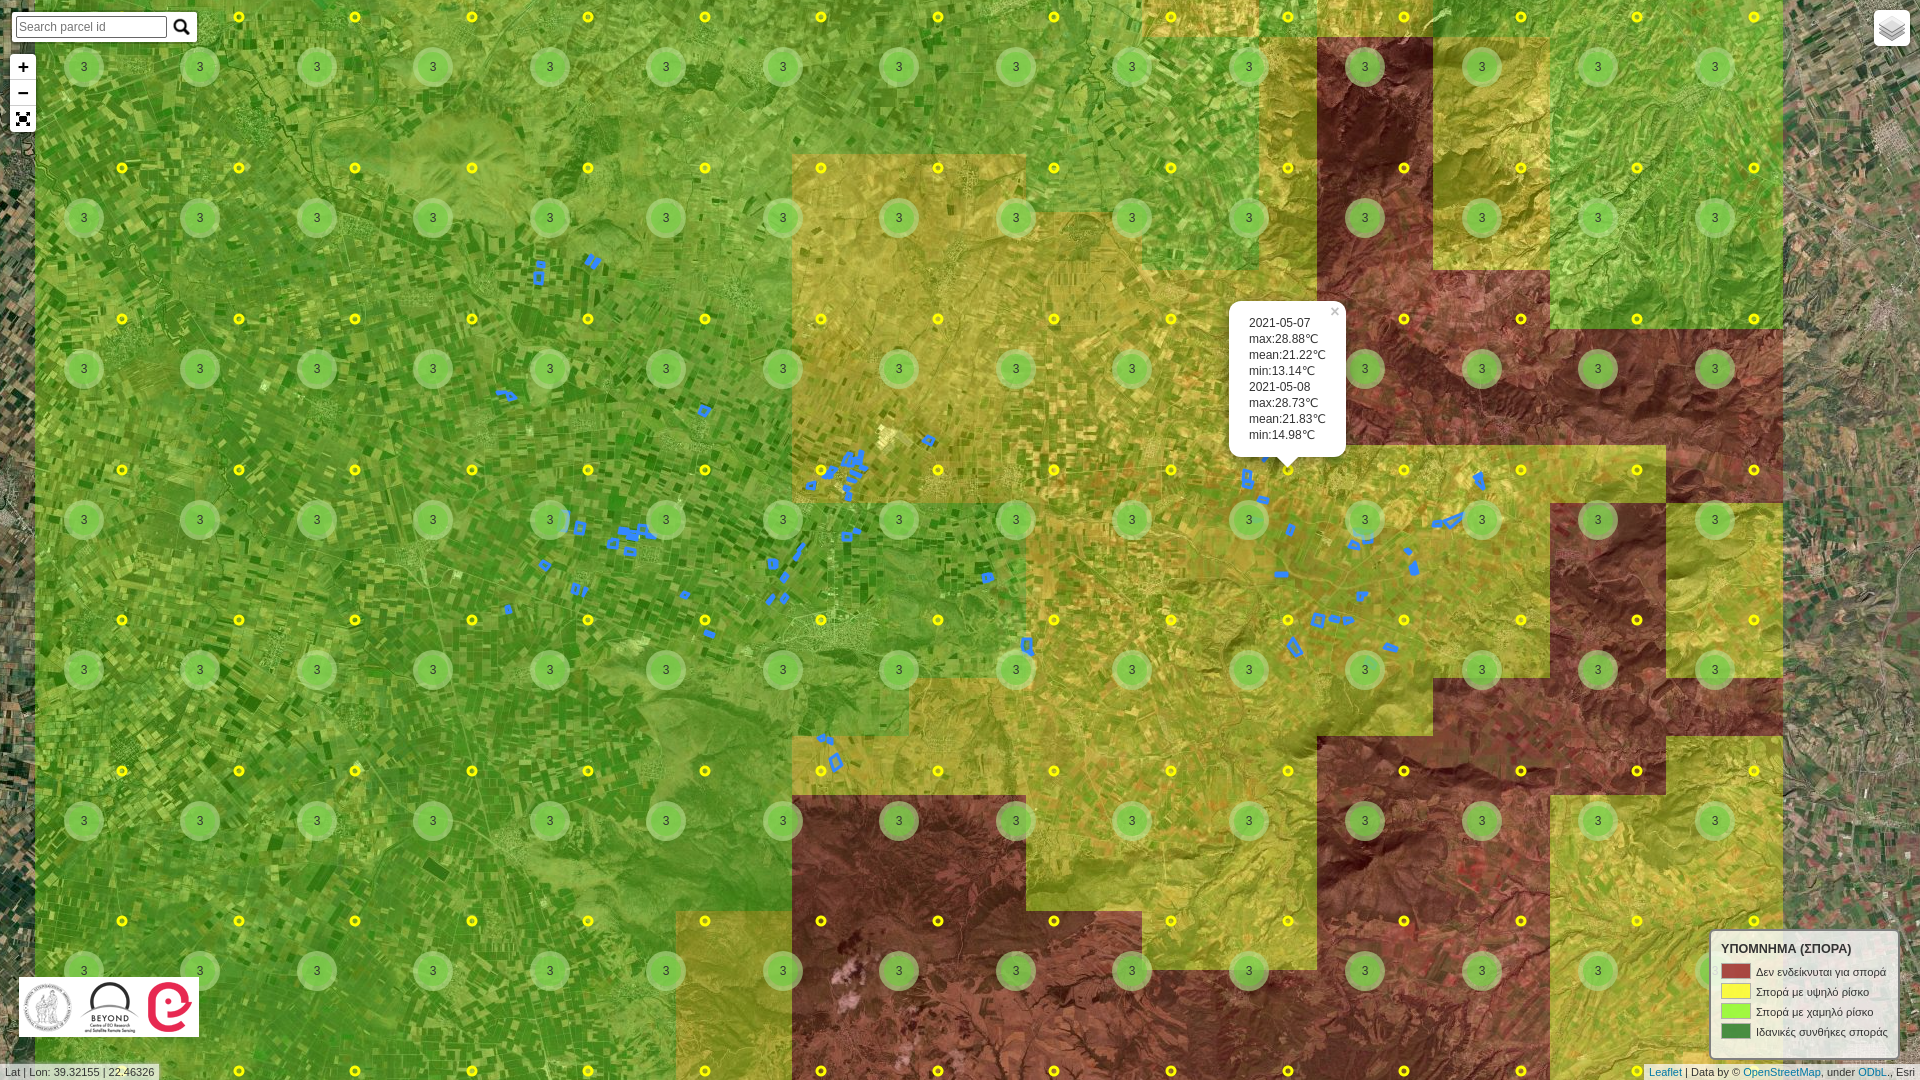 Image Removed Image Removed 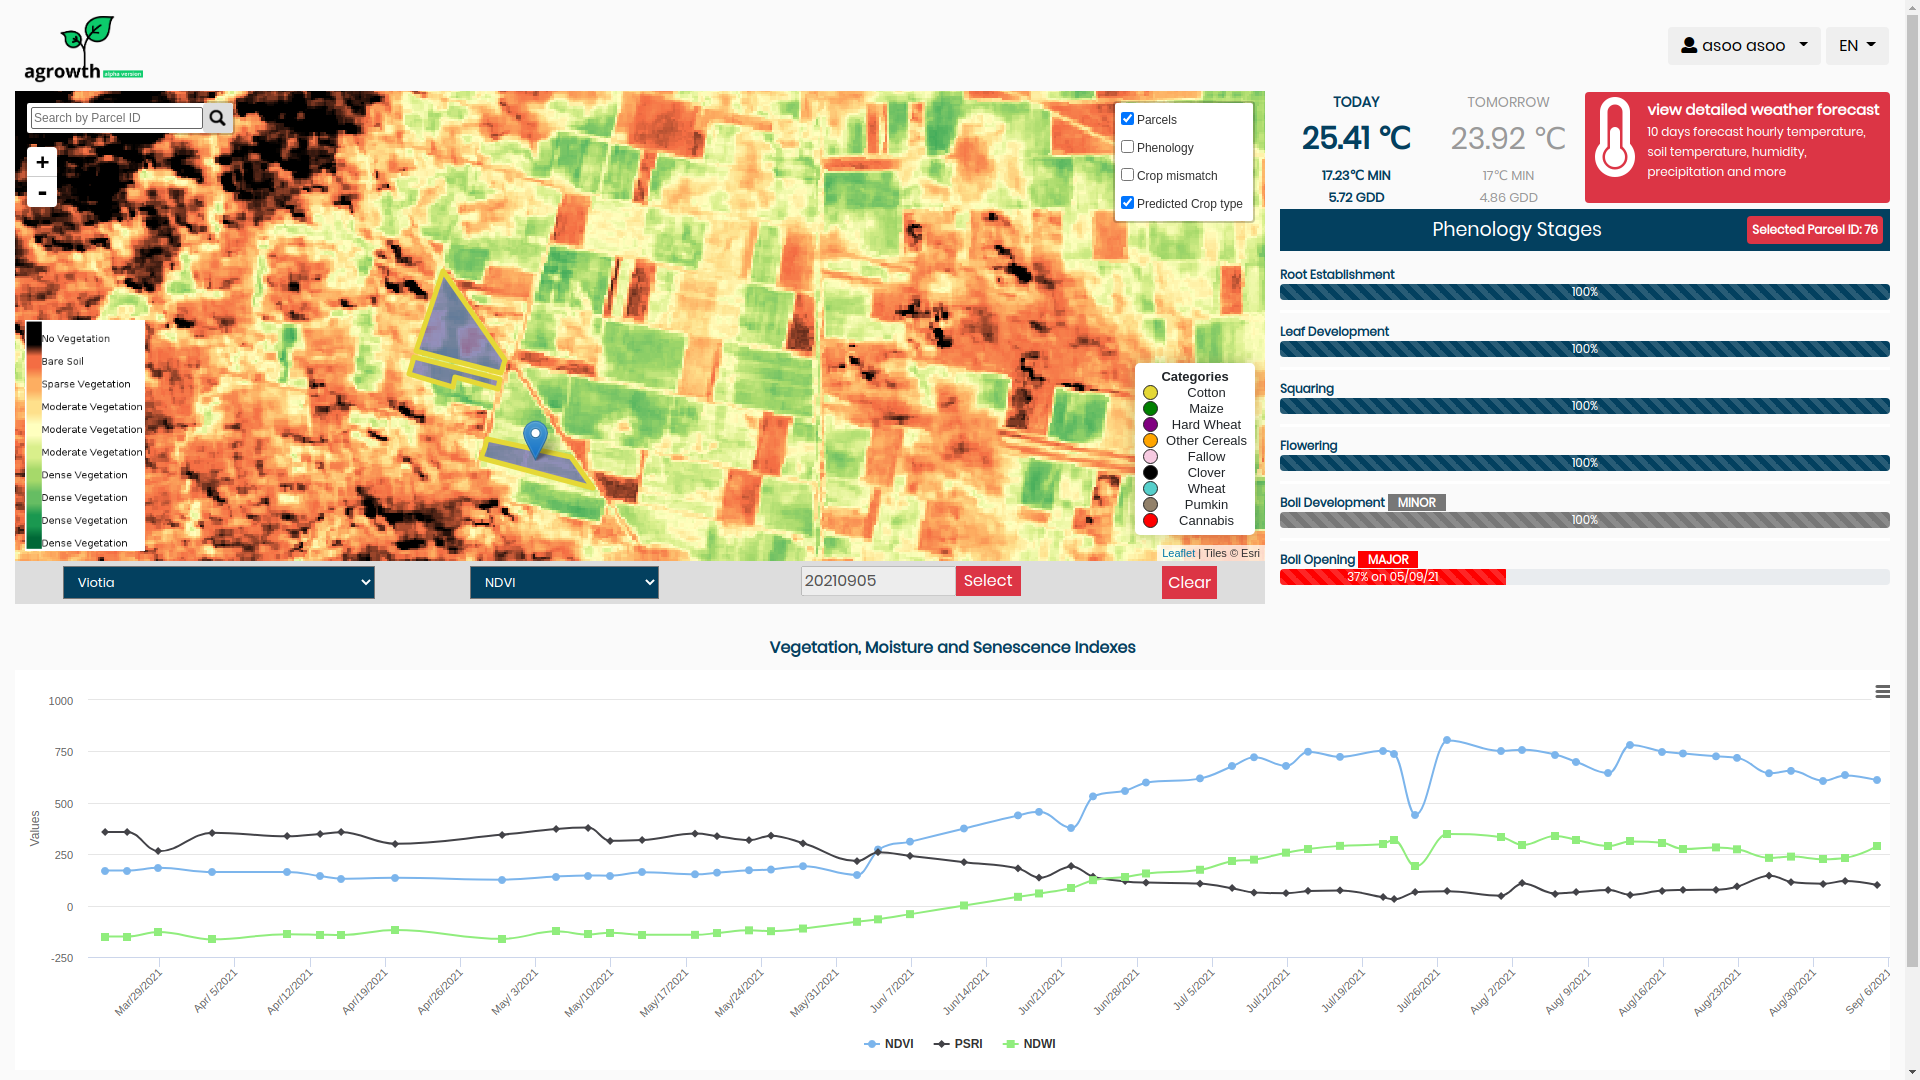 Image Removed Image Removed 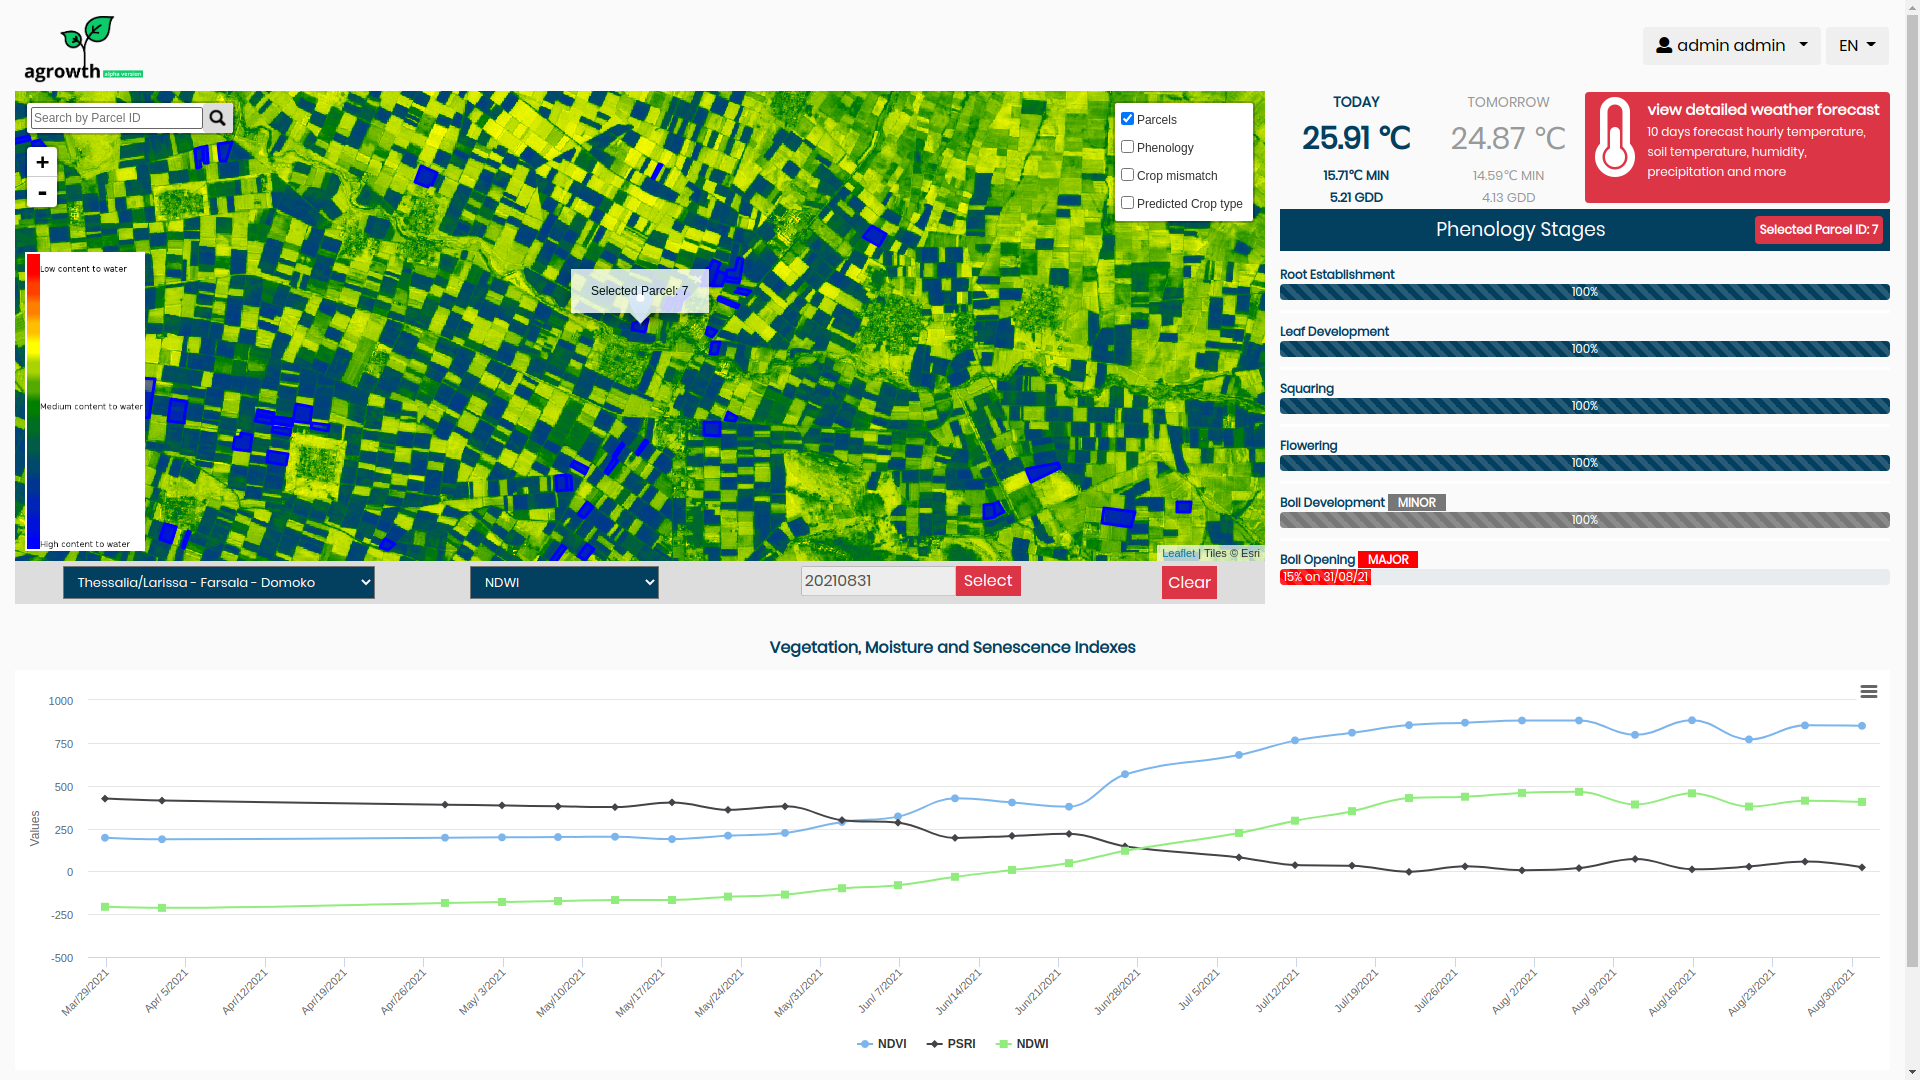 Image Removed Image Removed |