Demonstration of Rehabilitation/Revegetation | ||||||||
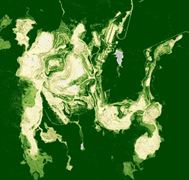
Observation in time of the normalized difference vegetation index (NDVI, July 2016, 2017 and 2019) at the Carajas mine, Brazil (source: Sentinel Hub). Dark green and green values represent tropical rain forest, whereas yellow and white colors correspond to the land disturbed by mining activities. | ||||||||
PRODUCT DESCRIPTION | ||||||||
Category | ||||||||
|
| |||||||
Uses | ||||||||
Design, Construction & Operations / Mine Closure & Aftercare
| ||||||||
Challenges addressed | ||||||||
| ||||||||
Geo-information needs | ||||||||
| ||||||||
Description | ||||||||
During mine closure and aftercare, actors in the mining industry must demonstrate that the area of the mining site has been rehabilitated and returned to an agreed endpoint. The endpoint is based on the baseline data gathered during the permitting period and vegetation and variety of vegetation covers are key metrics. In order to conduct such analysis, several earth observation (EO) products can be made use of:
| ||||||||
Known restrictions / limitations | ||||||||
The rate of growth for vegetation cover will vary depending on geography and climate. Where the rate of growth is relatively slow, an extended period of monitoring (years to decades) might be required to demonstrate a fully recovered habitat in the mining area. The recovery growth rate of the vegetation might be dependent on the evolution in time of a large number of factors such as infrastructure removal, air and water quality, water management and location of stockpiles. A continuous monitoring of each of those parameters over a long time period and the response of vegetation to their changes is therefore vital. In period of intense rehabilitation, a more frequent monitoring and a shorter period between reports might be required. Depending on the geography, climate and season, cloud coverage might be an issue in the investigation of the evolution of the rehabilitation and revegetation steps. | ||||||||
Lifecycle stage and demand | ||||||||
Exploration | Environmental Assessment and Permitting | Design, Construction and Operations | Mine Closure and Aftercare | |||||
■■■ | ■■ | ■■■■ | ||||||
Environmental Assessment & Permitting:
Design, Construction & Operations / Mine Closure & Aftercare:
| ||||||||
Geographic coverage | ||||||||
| Demand and coverage is global. | ||||||||
EARSC Thematic Domain | ||||||||
Domain | Land | |||||||
| Sub-domain | Land use | |||||||
| Product description | Monitor land cover and detection change | |||||||
PRODUCT SPECIFICATIONS | ||||||||
Input data sources | ||||||||
| Satellite | Sentinel-2 | Landsat-8 | GeoEye-1 | Worldview-1, 2 and 3 | SPOT 6, 7 | Pleiades | ||
| Status | In operation | In operation | In operation | In operation | In operation | In operation | ||
| Operator | ESA | NASA | Digital Globe | Digital Globe | Airbus | Airbus | ||
| Data availability | Public | Public | Commercial | Commercial | Commercial | Commercial | ||
| Resolution (m) | 10 - 60 | 15 - 100 | 0.46 | 0.31 - 0.46 | 1.5 | 0.5 | ||
| Coverage | Global | Global | Global | Global | Global | Global | ||
| Frequency (days) | 5 | 16 | < 3 | < 2 | < 1 | < 1 | ||
| Launch year | 2015 | 2013 | 2008 | 2007/2009/2014 | 2012/2014 | 2011 | ||
Website | link | link | link | link | link | link | ||
| NOTE: Airborne and drone imagery products for local and regional analysis might also be used in order to obtain higher image resolution. | ||||||||
Minimum Mapping Unit (MMU) | ||||||||
Minimum detectable feature size (dependent on the input pixel resolution, ~1 - 3 px) | ||||||||
Accuracy / constraints | ||||||||
Thematic accuracy: >85% threshold for overall accuracy / class accuracy. Spatial accuracy: Dependent on the input pixel resolution; typically, 0.5 - 1 pixel. | ||||||||
Accuracy assessment approach & quality control measures | ||||||||
Dependent on the input pixel resolution; typically, ~0.5 - 1 pixel. | ||||||||
Timeliness | ||||||||
Digitization of ongoing rehabilitation steps and revegetation from imagery products can be completed within a few days of work, dependent on how large the rehabilitated area is and the number of activities. Rehabilitation/revegetation changes likely to be reported on a weekly to yearly basis. | ||||||||
Availability | ||||||||
Data from Sentinel satellites are freely available through the open data policy of the European Space Agency. Data is made available typically within 6-12 hours of satellite fly-over (similar for Landsat through NASA open data policy). GeoEye-1, Worldview, SPOT and Pleiades data are commercially licensed and must be purchased through operator/vendor. Usually available within hour(s) of satellite fly-over. Airborne and drone imagery products can be purchased through operator/vendor. Usually available within hours or days after acquisition. | ||||||||
Delivery / output format | ||||||||
Rehabilitation steps Map showing conducted and planned rehabilitation steps Output: vector formats - shapefile, reports of specified and/or requested key indicators, client-specified spatial formats Land cover Map showing the land cover in the region of interest (evolution in time) Output: - raster formats - GeoTiff, reports of specified and/or requested key indicators, client-specified spatial formats Vegetation index Map showing the vegetated areas and their conditions (evolution in time) Output: - raster formats - GeoTiff, reports of specified and/or requested key indicators, client-specified spatial formats | ||||||||
USE CASE | ||||||||
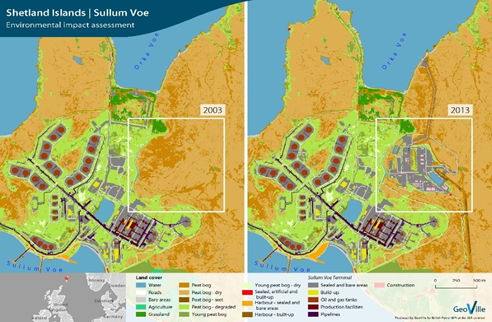
Source: GeoVille Shetland Islands – Environmental impact assessment The aim of this project was to support environmental impact assessment and to provide guidance to minimize ecological impacts and to value ecosystem services in the region. A detailed very high-resolution land cover and land use classification was provided. The examples were used to identify valuable ecosystem services, to recognize ecosystem services dependencies and the impact caused by the operations. In terms of vegetation and rehabilitation mapping for the mining sector, this method may also be applied to map the baseline conditions as well as monitor changes. | ||||||||


This page has no comments.