Water Quality | ||||||||
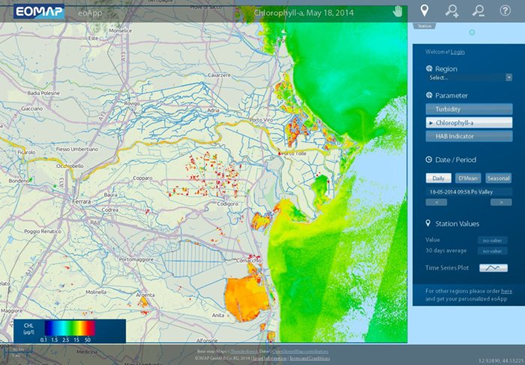
Chlorophyll Content (Source: EOMAP) | ||||||||
PRODUCT DESCRIPTION | ||||||||
Category | ||||||||
|
| |||||||
Uses | ||||||||
| ||||||||
Challenges addressed | ||||||||
| ||||||||
Geo-information needs | ||||||||
| ||||||||
Description | ||||||||
The assessment of water quality is vital during mining activities as well as in the aftercare. Spatial and temporal information can be provided to identify the ecological status of waters as well as changes and trends. Various water quality problems can be detected, such as point source pollution, sedimentation, harmful algae blooms or aquatic weeds. Gradual and abrupt changes might be detected. Long-term or gradual changes are usually indicated by long-term events such as climate change, whereas abrupt changes usually suggest point source pollution from industry. The Total Suspended Matter (TSM) is one indicator that can be calculated. Through the spectral response and reflectance of electromagnetic radiation, parameters and concentrations of sediment can be detected. Furthermore, the phytoplankton biomass indicates concentrations of chlorophyll in water bodies. Spatial distributions and temporal changes can be derived. Using thermal infrared sensors, the measurement of water temperature is possible. The Diffuse Attenuation Coefficient reports on the transparency of water by computing the upwelling radiances at a special wavelength of 490 nm. For processing, imagery from sensors MODIS, Landsat 8, Sentinel-2 or Sentinel-3 might be used. The final product may be a report with various indicators with maps visualizing the current status of the parameters, changes and highlighting problematic changes. Also, web browsers and apps are a possible way of delivering the various indicators. Due to the continuous observation from space, a constant monitoring of these indicators is possible. However, the frequency is dependent on the revisit time of used input data source. | ||||||||
Known restrictions / limitations | ||||||||
| Although used satellites have a high temporal observation frequency, the information might be limited by the coarse spatial resolution, dependent on the satellite data used. Furthermore, sun glint or haze on satellite imagery might make them useless. | ||||||||
Lifecycle stage and demand | ||||||||
Exploration | Environmental Assessment and Permitting | Design, Construction and Operations | Mine Closure and Aftercare | |||||
■■■ | ■■■■■ | ■■■■■ | ||||||
Environmental Assessment & Permitting:
Design, Construction & Operations:
Mine Closure & Aftercare: Demonstrate water quality has returned to baseline conditions or to other agreed endpoints. | ||||||||
Geographic coverage | ||||||||
| Globally available. | ||||||||
EARSC Thematic Domain | ||||||||
Domain | LAND | OCEAN & MARINE | ||||||
| Sub-domain | Inland Water | Coastal | ||||||
| Product description | Assess and monitor water bodie | Assess and monitor coastal water quality | ||||||
PRODUCT SPECIFICATIONS | ||||||||
Input data sources | ||||||||
| Satellite | Sentinel 2 | Landsat 8 | MODIS | Sentinel 3 | ||||
| Status | In operation | In operation | Archive | In operation | ||||
| Operator | ESA | NASA | Digital Globe | ESA | ||||
| Data availability | Public | Public | Public | Public | ||||
| Resolution (m) | 10 - 60 | 15 - 100 | 1 – 4 | 300 | ||||
| Coverage | Global | Global | Global | Global | ||||
| Frequency (days) | 5 | 16 | < 3 | 27 | ||||
| Launch year | 2015 | 2013 | 1999 - 2015 | 2016 / 2018 | ||||
Website | link | link | link | link | ||||
Minimum Mapping Unit (MMU) | ||||||||
Variable, depending on source data resolution. | ||||||||
Accuracy / constraints | ||||||||
Thematic accuracy: Water quality problems such as point source pollution, sedimentation, harmful algae blooms or aquatic weeds can be detected. Spatial accuracy: Dependent on input pixel resolution; typically 0.5 – 1 pixel. | ||||||||
Accuracy assessment approach & quality control measures | ||||||||
N/A (A validation of remote sensing analyses with ground truth data might be required; fieldwork might be thus required or the installation of water quality stations. | ||||||||
Frequency / timeliness | ||||||||
Observation frequency: Timeliness of deliverable: | ||||||||
Availability | ||||||||
Data from all Sentinel satellites are freely available through the open data policy of the operator ESA (Sentinel-2A since 2015, Sentinel-3A since 2016, Sentinel-2B since 2017, Sentinel-3B since 2018). Data from Landsat 8 (since 2013) are freely available through the open data policy of the operator USGS. | ||||||||
Delivery / output format | ||||||||
Data type: Raster formats File format: Geotiff Further delivery formats: Paper maps, Reports, Indicators, web portal | ||||||||
USE CASE | ||||||||
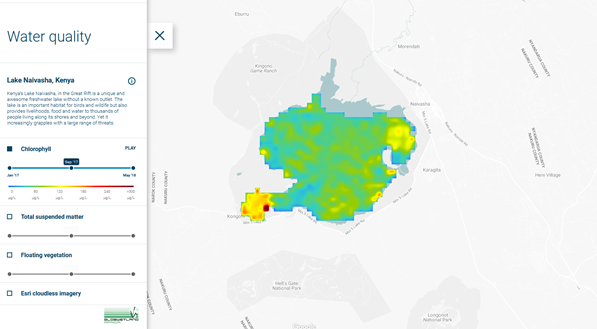
Source: GlobWetland, http://globwetland-africa.org/ This image shows the chlorophyll concentration of Lake Naivasha, Kenya. Together with the turbidity and the Total Suspended Matter, these indicators provide parameters for the water quality. The picture indicates, that water quality may also be assessed on smaller inland water lakes. Data can be easily shown on a portal where the different layers are to be selected to enable a good examination on water quality. | ||||||||
This page has no comments.