Vegetation Mapping | ||||||||
Ecosystem monitoring (Source: GeoVille) | ||||||||
PRODUCT DESCRIPTION | ||||||||
Category | ||||||||
|
| |||||||
Uses | ||||||||
| ||||||||
Challenges addressed | ||||||||
| ||||||||
Geo-information needs | ||||||||
| ||||||||
Description | ||||||||
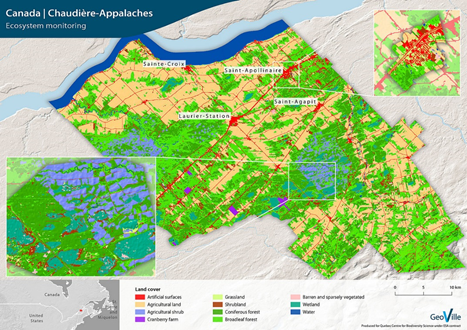
To understand the environmental impact of mining activities and to get information about rehabilitation criteria, mapping and monitoring of Flora and Fauna in the area of influence of any mining activity is required. Base assessment and monitoring of Flora and Fauna require ground sampling methods. EO can support this activity with vegetation mapping covering land areas as well as underwater areas on a local scale. With various image classification methods, vegetation types can be identified on various scales. Vegetation Indices (VI) are good indicators used to identify and map different vegetation types. For example, the Normalized Difference Vegetation Index (NDVI) gathers information on the radiances in red- and near-infrared regions. Through the dynamic signals of the NDVI and other indices it is possible to identify particular vegetation groups and dynamic changes. The Enhanced Vegetation Index (EVI) is another example. Compared to the NDVI, it has an improved sensitivity and better responds to structural variations in the canopy. Vegetation types and changes are detected by using spectral signature, structure or phenology profiles. With the analysis of signatures it is possible to identify various classes, such as different forest, woodland, shrubland, grassland and other vegetation types. Radar imagery helps to get into depth with mapping forest and land cover. With this data remote sensing is able to map structural attributes such as height, biomass, volume and basal area; monitor changes (deforestation, degradation, reforestation) as well as photosynthetic processes, e.g. growing-season length. Vegetation stress and changes therein may also be detected with remote sensing through different methodologies, using mainly time series of vegetation indices such as fAPAR (Fraction of Absorbed Photosynthetically Active Radiation), LAI (Leaf Area Index) or the NDVI. Active and passive microwave techniques such as SAR imagery provides | ||||||||
Known restrictions / limitations | ||||||||
| How well a product represents the actual vegetation is highly dependent on the quality and resolution of satellite imagery. Concerning change products consistent data from the same sources and the same period for the entire region is needed. | ||||||||
Lifecycle stage and demand | ||||||||
Exploration | Environmental Assessment and Permitting | Design, Construction and Operations | Mine Closure and Aftercare | |||||
| ■ | ■■■■ |
| ■■■ | |||||
Exploration:
Environmental Assessment & Permitting:
Mine Closure & Aftercare:
| ||||||||
Geographic coverage | ||||||||
| Globally available. | ||||||||
EARSC Thematic Domain | ||||||||
Domain | LAND | |||||||
| Sub-domain | Topography | |||||||
| Product description | Baseline mapping | |||||||
PRODUCT SPECIFICATIONS | ||||||||
Input data sources | ||||||||
| Satellite | Sentinel 1 | Sentinel 2 | Landsat 8 | SPOT 6, 7 | IKONOS | Landsat 9 | ||
| Status | In operation | In operation | In operation | In operation | Archive | Planned | ||
| Operator | ESA | ESA | NASA | Airbus Defence and Space | Digital Globe | NASA | ||
| Data availability | Public | Public | Public | Commer-cial, on demand | Public | Public | ||
| Resolution (m) | 5 - 100 | 10 - 60 | 15 - 100 | 1.5 | 1 - 4 | 15 - 100 | ||
| Coverage | Global | Global | Global | Global | Global | Global | ||
| Frequency (days) | < 3 | 5 | 16 | < 1 | < 3 | |||
| Launch year | 2014 | 2015 | 2013 | 2012/2014 | 1999-2015 | 2020 | ||
Website | link | link | link | link | link | link | ||
Minimum Mapping Unit (MMU) | ||||||||
Variable, depending on source data resolution. A MMU as small as 0,5 ha is possible using VHR. | ||||||||
Accuracy / constraints | ||||||||
Thematic accuracy: 90 % for vegetation types. Spatial accuracy: Sub-pixel accuracy (i.e. <10m for Sentinel products) | ||||||||
Accuracy assessment approach & quality control measures | ||||||||
Accuracy is assessed by comparing class labels in the derived thematic map with ground data from the location. A confusion or error matrix describes the accuracy between derived classes and reference data. Usually, an accuracy of 80–90 % is reached. | ||||||||
Frequency / timeliness | ||||||||
Observation frequency: Every one or more days, depending on satellite. Timeliness of delivery: Within five (working) days of sensing. | ||||||||
Availability | ||||||||
Data from all Sentinel satellites are freely available through the open data policy of the operator ESA (Sentinel-1A since 2014, Sentinel-2A since 2015, Sentinel-1B since 2016, Sentinel-2B since 2017). Data from Landsat 8 (since 2013) are freely available through the open data policy of the operator USGS. IKONOS (1999–2015) and SPOT data (SPOT 6: since 2012; SPOT 7 since 2014) are freely available through the portal of ESA. | ||||||||
Delivery / output format | ||||||||
Data type: Vector formats, Raster formats File format: Geotiff, Shapefile Further delivery formats: Paper maps, Statistical progress/change report | ||||||||
USE CASE | ||||||||
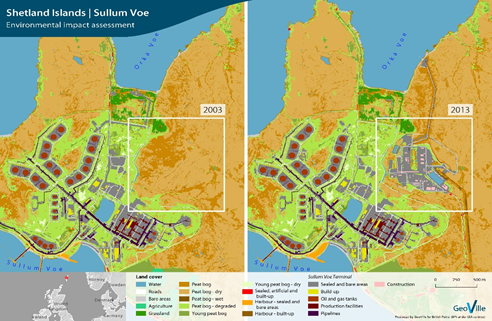
Source: GeoVille Shetland Islands – Environmental impact assessment The aim of this project was to support environmental impact assessment and to provide guidance to minimize ecological impacts and to value ecosystem services in the region. A detailed very high-resolution land cover and land use classification was provided. The examples were used to identify valuable ecosystem services, to recognize ecosystem services dependencies and the impact caused by the operations. In terms of vegetation mapping for the mining sector, this method may also be applied to map the status quo as well as monitor changes. | ||||||||
This page has no comments.