Protected Areas | ||||||||
PRODUCT DESCRIPTION | ||||||||
Category | ||||||||
|
| |||||||
Uses | ||||||||
Exploration, Environmental Assessment & Permitting
Design, Construction & Operations
Mine Closure & Aftercare Baseline information for rehabilitation/revegetation steps | ||||||||
Challenges addressed | ||||||||
| ||||||||
Geo-information needs | ||||||||
| ||||||||
Description | ||||||||
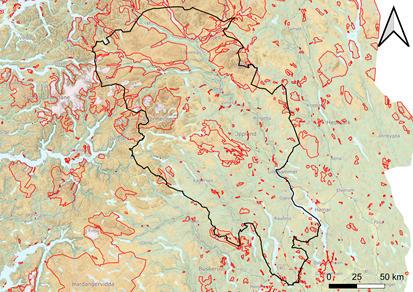
This product provides an overview of the protected areas in the region of interest. Their mapping and locations relative to the potential mining site are of importance in the exploration, assessment and approval steps of the mining cycle. Products such as Natura2000 (protected areas in the European Union), location of national parks, conservation areas and cultural heritage (i.e., types of protected areas) are often directly available from national mapping authorities. In the eventually of such product being unavailable or of insufficient accuracy, the locations of protected areas can be directly extracted from optical imagery products (provided the help of a biologist/environmental engineer with local knowledge). A summary of the most used satellites (on which, optical sensors are available) are given in the table of the input data sources section. | ||||||||
Known restrictions / limitations | ||||||||
| Spatial resolution of the boundary of protected areas from satellite-based EO are relatively coarse and may require additional refinement depending on the distance from the potential mining area. | ||||||||
Lifecycle stage and demand | ||||||||
Exploration | Environmental Assessment and Permitting | Design, Construction and Operations | Mine Closure and Aftercare | |||||
| ■■■ | ■■■■ | ■■ | ■■ | |||||
Geographic coverage | ||||||||
| Demand and coverage are global. | ||||||||
EARSC Thematic Domain | ||||||||
Domain | Land | |||||||
| Sub-domain | Land use | |||||||
| Product description | Assess land value, ownership and type | |||||||
PRODUCT SPECIFICATIONS | ||||||||
Input data sources | ||||||||
| Satellite | Sentinel-2 | Landsat-8 | GeoEye-1 | Worldview-1, 2 and 3 | SPOT 6, 7 | Pleiades | ||
| Status | In operation | In operation | In operation | In operation | In operation | In operation | ||
| Operator | ESA | NASA | Digital Globe | Digital Globe | Airbus | |||
| Data availability | Public | Public | Commercial | Commercial | Commercial | Commercial | ||
| Resolution (m) | 10 - 60 | 15 - 100 | 0.46 | 0.31 - 0.46 | 1.5 | 0.5 | ||
| Coverage | Global | Global | Global | Global | Global | Global | ||
| Frequency (days) | 5 | 16 | < 3 | < 2 | < 1 | < 1 | ||
| Launch year | 2015 | 2013 | 2008 | 2007/2009/2014 | 2012/2014 | 2011 | ||
Website | link | link | link | link | link | link | ||
| NOTE: Airborne and drone imagery products for local and regional analysis might also be used in order to obtain higher image resolution. | ||||||||
Minimum Mapping Unit (MMU) | ||||||||
Minimum detectable feature size (dependent on input pixel resolution, ~1 – 3 px) | ||||||||
Accuracy / constraints | ||||||||
Thematic accuracy: Protected areas should be detected given the fact the areas are larger than the minimum detectable feature size. Spatial accuracy: Dependent on the input pixel resolution; typically, ~0.5 - 1 pixel. | ||||||||
Accuracy assessment approach & quality control measures | ||||||||
Dependent on the input pixel resolution; typically, ~0.5 - 1 pixel. | ||||||||
Frequency / timeliness | ||||||||
Digitalization of protected areas (if not available) from imagery products can be completed within a few hours/days of work, dependent on the extent of the potential mining area and the presence of nearby protected areas (one-time task). | ||||||||
Availability | ||||||||
Data from Sentinel satellites are freely available through the open data policy of the European Space Agency. Data is made available typically within 6-12 hours of satellite fly-over. GeoEye-1, Worldview, SPOT and Pleiades data are commercially licensed and must be purchased through operator/vendor. Usually available within hour(s) of satellite fly-over. Airborne and drone imagery products can be purchased through operator/vendor. Usually available within hours or days after acquisition. | ||||||||
Delivery / output format | ||||||||
Protected areas Map of protected areas (national parks, cultural locations…) in the region of interest Output: vector formats - shapefile, client-specified spatial formats, report on key indicators | ||||||||
USE CASE | ||||||||
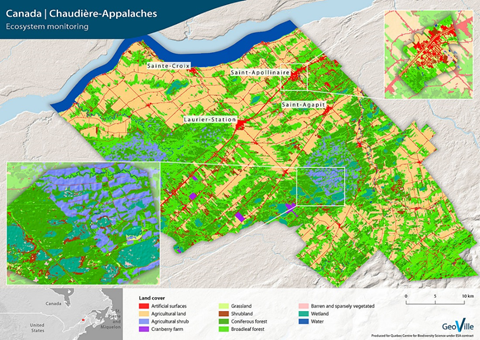
Source: GeoVille Canada Appalaches – Ecosystem monitoring The aim of this project was to assess the ecosystem of the entire Chaudiere-Appalaches region in Canada. A detailed very high-resolution land cover classification was provided for the region. This method may also be applied in the mining sector to identify areas (of conservation) which may need to be protected/avoided during mining operations. | ||||||||
This page has no comments.