National Monuments | ||||||||
Mosaic picture of the 7 wonders, source: Archdaily. | ||||||||
PRODUCT DESCRIPTION | ||||||||
Category | ||||||||
|
| |||||||
Uses | ||||||||
Exploration
Environmental, assessment & permitting
Construction, operations and aftercare
| ||||||||
Challenges addressed | ||||||||
| ||||||||
Geo-information needs | ||||||||
| ||||||||
Description | ||||||||
This product provides information on national monuments and areas of cultural and heritage value that may be sensitive to damage caused by mining activities. Their mapping and locations relative to the potential mining site are of importance in the exploration, assessment and approval steps of the mining cycle. Given an estimation of the land area disturbed by the mining operation is provided, a list of the locations of national monuments potentially at risk will be provided. The locations of national monuments are often directly available from national mapping authorities (e.g., the Norwegian Mapping Authority gives access to shapefiles containing important infrastructures). In the eventually of such product being unavailable or of insufficient accuracy, the locations of national monuments can be directly extracted from optical visible images (provided the availability of a database of the national monuments within the region of interest). In the event of a granted permission for mining activities and the presence of close-by national monuments, millimetre accuracy will be required to establish baseline ground elevation data for the monuments and demonstrate that no movement, that could result in permanent damage, was caused by the mining activity. Sentinel-1 satellite products (Interferometric Synthetic Aperture Radar, inSAR) have been previously used to conduct such subsidence analysis providing high-resolution monitoring of the deformation of the surface. | ||||||||
Known restrictions / limitations | ||||||||
Different levels of resolution may be required to map infrastructures and areas of cultural and heritage value. The required resolution will vary depending on the size of the monument of interest but may be as small as 1m2, for example for standing stones or may be hundreds of m2 for protected buildings and gardens. Surface deformation caused by mining activity might have possibly a rather long and offset response. Continuous and long-time monitoring might therefore be required after mine closure to detect such influence. | ||||||||
Lifecycle stage and demand | ||||||||
Exploration | Environmental Assessment and Permitting | Design, Construction and Operations | Mine Closure and Aftercare | |||||
| ■■ | ■■■■ | ■■■ | ■■■ | |||||
Environmental Assessment & Permitting:
Design, Construction and Operations / Mine Closure & Aftercare
Comparison to baseline data in order to prove that mining operation did not lead to any movement of structures. | ||||||||
Geographic coverage | ||||||||
| Demand and coverage is global. | ||||||||
EARSC Thematic Domain | ||||||||
Domain | Land | |||||||
| Sub-domain | Topography | |||||||
| Product description | Detect and monitor ground movement | |||||||
PRODUCT SPECIFICATIONS | ||||||||
Input data sources | ||||||||
| Satellite | Sentinel-1 | Sentinel-2 | Landsat-8 | GeoEye-1 | Worldview-1, 2 and 3 | SPOT 6, 7 | ||
| Status | In operation | In operation | In operation | In operation | In operation | In operation | ||
| Operator | ESA | ESA | NASA | Digital Globe | Digital Globe | Airbus | ||
| Data availability | Public | Public | Public | Commercial | Commercial | Commercial | ||
| Resolution (m) | 5 | 10 - 60 | 15 - 100 | 0.46 | 0.31 - 0.46 | 1.5 | ||
| Coverage | Global | Global | Global | Global | Global | Global | ||
| Frequency (days) | 12 | 5 | 16 | < 3 | < 2 | < 1 | ||
| Launch year | 2014 | 2015 | 2013 | 2008 | 2007/2009/2014 | 2012/2014 | ||
Website | link | link | link | link | link | link | ||
| NOTE: Airborne and drone imagery products for local and regional analysis might also be used in order to obtain higher image resolution. | ||||||||
Minimum Mapping Unit (MMU) | ||||||||
Minimum detectable feature size (dependent on input pixel resolution, ~1 - 3 px) | ||||||||
Accuracy / constraints | ||||||||
Thematic accuracy: >85% threshold for overall accuracy / class accuracy. Spatial accuracy: Dependent on input pixel resolution; typically ~0.5 - 1 pixel. | ||||||||
Accuracy assessment approach & quality control measures | ||||||||
Dependent on input pixel resolution; typically ~0.5 - 1 pixel (~mm to m). | ||||||||
Frequency / timeliness | ||||||||
Digitalization of national monuments from imagery products can be completed within a few hours/days of work, dependent on the number of national monuments in (or close-by) the potential mining area. Once in a time task. Very high-resolution Digital Surface Model (DSM), Digital Terrain Model (DTM) and subsidence analysis can be generated within a few days of imagery product acquisition, dependent on how large the region of interest is (baseline and continuous monitoring). In general, the “National Monuments” product does not require high-frequency measurement but include more once in a time task (digitalization of the location of national monuments) and long-term monitoring (~ yearly analysis of subsidence). | ||||||||
Availability | ||||||||
Data from Sentinel satellites are freely available through the open data policy of the European Space Agency. Data is made available typically within 6-12 hours of satellite fly-over (similar for Landsat through NASA open data policy). GeoEye-1, Worldview and SPOT data are commercially licensed and must be purchased through operator/vendor. Usually available within hour(s) of satellite fly-over. Airborne and drone imagery products can be purchased through operator/vendor. Usually available within hours or days after acquisition. | ||||||||
Delivery / output format | ||||||||
Ground elevation measurements (subsidence) Maps showing ground elevation changes over time for specific national monuments. Output: raster formats - GeoTiff, client-specified raster formats, report on key indicators. National monuments Map showing the given location of national monuments close-by the mining site. Output: vector formats - shapefile, client-specified spatial formats, report on key indicators. | ||||||||
USE CASE | ||||||||
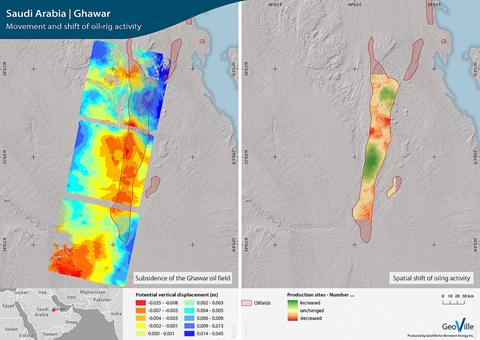
Source: GeoVille Saudi Arabia – Ghawar The aim of this project was to assess potential vertical displacement at the surface due to oil-rig activities in the region of Ghawar, Saudi Arabia. Areas subjected to increased and decreased vertical displacements can be mapped from subsidence measurements (e.g., from Sentinel-1 images). This method may also be applied in the mining sector to for example identify surface movements possibly caused by mining activities. Such maps can be used to assess whether monuments located in the surroundings have been affected by surface movements. | ||||||||

This page has no comments.