Monitoring of Infrastructure | ||||||||
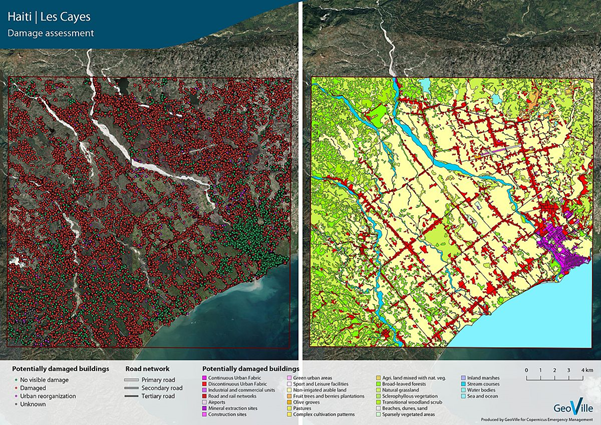
Damage assessment (Source: GeoVille) | ||||||||
PRODUCT DESCRIPTION | ||||||||
Category | ||||||||
|
| |||||||
Uses | ||||||||
| ||||||||
Challenges addressed | ||||||||
| Development and Operations – Structural Stability | ||||||||
Geo-information needs | ||||||||
| ||||||||
Description | ||||||||
In the surrounding area of mining activities it is a must to monitor all buildings, roads and other facilities to make sure they are structurally sound. Especially those buildings near to, or over, underground workings are highly important to take into account. Trigger values may define where movement is tolerable and when there is a need to a corrective response. A complete inventory of building structures as well as an additional input on transport network is highly important to perform comprehensive damage and vulnerability assessment. The transport network, especially railways and roads, are essential information for logistics especially in the planning phase of a mine. Regarding potential damages due to the mining activities, it is vital to know about the road status and its conditions. This additional data can be obtained through other EO products. This product gives information on potential damages on buildings and other infrastructural facilities such as road network. The detection and identification of these deteriorations and damages is quite a challenging task. Various image data might be used as input, such as multispectral or hyperspectral camera, Synthetic Aperture Radar (SAR), LiDAR and Terrestrial Laser Scanning. There is furthermore a high potential of using Differential Interferometry SAR (DInSAR) data. As damages sometimes occur subtle and range within centimeters it is often difficult to detect. When using high-resolution SAR images this is performed comparing images over time with a reference image where infrastructure is intact. This way, damages can be detected directly. It is also possible to indirectly spot potentially endangered areas where damages are possible and might happen in the future. Steep slopes, soft soils and areas with extreme precipitation are examples for areas which are more sensitive for movement. This information could also work as an early warning indicating possible damages on buildings or roads. | ||||||||
Known restrictions / limitations | ||||||||
The size and accuracy of the provided data is highly dependent on the sensors used and its resolution. Using open available data, a resolution of up to 5m can be reached. Detection of transport network is often limited in forested areas or alleys where the visibility of roads is restricted by treetops. Whereas in mountainous areas it can be hard to detect streets due to problems with sensor geometry. | ||||||||
Lifecycle stage and demand | ||||||||
Exploration | Environmental Assessment and Permitting | Design, Construction and Operations | Mine Closure and Aftercare | |||||
| ■■■■ | ■■ | ||||||
Design, Construction & Operations:
Mine Closure & Aftercare:
| ||||||||
Geographic coverage | ||||||||
EARSC Thematic Domain | ||||||||
Domain | BUILT ENVIRONMENT | |||||||
| Sub-domain | Infrastructure | |||||||
| Product description | Asset infrastructure monitoring; Monitor transport networks | |||||||
PRODUCT SPECIFICATIONS | ||||||||
Input data sources | ||||||||
| Satellite | Sentinel 1 | TerraSAR-X | SkySat | Worldview 1, 2 and 3 | ||||
| Status | In operation | In operation | In operation | In operation | ||||
| Operator | ESA | DLR/Astrium | Planet Labs | Digital Globe | ||||
| Data availability | Public | Commercial, on demand | Commercial, on demand | Commercial, on demand | ||||
| Resolution (m) | 5 - 100 | 1 - 16 | 0.72 - 1 | 0.31 - 0.46 | ||||
| Coverage | Global | Global | Global | Global | ||||
| Frequency (days) | < 3 | < 5 | 4 - 5 | < 2 | ||||
| Launch year | 2014 | 2007 | 2013 | 2007 / 2009 / 2014 | ||||
Website | link | link | link | link | ||||
Minimum Mapping Unit (MMU) | ||||||||
Variable, depending on source data resolution. A MMU as small as 1 m pixel size is possible using VHR. | ||||||||
Accuracy / constraints | ||||||||
Thematic accuracy: Deterioration, 80-90%. Spatial accuracy: Sub-pixel accuracy (i.e. <10m for Sentinel products) | ||||||||
Accuracy assessment approach & quality control measures | ||||||||
Accuracy is assessed by performing a visual damage inspection with optical high-resolution imagery. | ||||||||
Frequency / timeliness | ||||||||
Observation frequency: Every one or more days, depending on satellite. Timeliness of delivery: Within five (working) days of sensing. | ||||||||
Availability | ||||||||
Data from all Sentinel satellites are freely available through the open data policy of the operator ESA (Sentinel-1A since 2014, Sentinel-1B since 2016). TerraSAR-X, Worldview, as well as SkySat data are commercially licenses and must be purchased through the operator/vendor. TerraSAR-X satellite imagery is commercially available through EADS Astrium GmbH; WorldView is provided by DigitalGlobe and SkySat is distributed through Planet Labs. Usually available within hour(s) of satellite fly-over. | ||||||||
Delivery / output format | ||||||||
Data type: Vector formats, Raster formats File format: Geotiff, Shapefile Other delivery format: Report | ||||||||
USE CASE | ||||||||
Damage assessment (Source: GeoVille) Exposure Mapping This map shows an EO based analysis of flood-risk and vulnerability hotspot identification. This supports risk assessment and management. With additional information such as building footprints or population data, it is possible to identify highly exposed areas that could be affected e.g. in case a certain damage shift or movement occurs. However, such maps may not only cover exposure mapping, in case of any damages, it is possible to identify affected areas and areas that are under risk to take appropriate actions. | ||||||||

This page has no comments.