Lithology and Surficial Geology Mapping | ||||||||
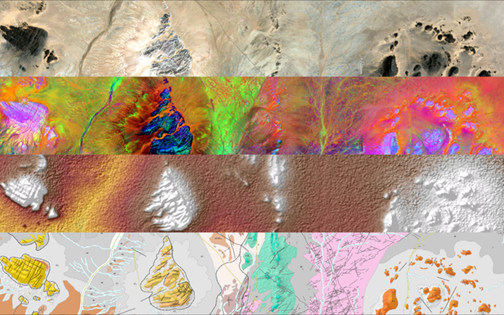
Details of the geological mapping layers for the Western Sahara demonstration area. From top to bottom: Sentinel-2 natural colour composite, Sentinel-2 principal components analysis, Shuttle Radar Topography Mission-based elevation and the resulting geological map at 1:50000 scale. (Source: ESA) | ||||||||
PRODUCT DESCRIPTION | ||||||||
Category | ||||||||
|
| |||||||
Uses | ||||||||
| Exploration – Exploration companies need to know the mineral composition of the area they are exploring. This product can support the nee by estimating the lithology using earth observation. | ||||||||
Challenges addressed | ||||||||
| ||||||||
Geo-information needs | ||||||||
| ||||||||
Description | ||||||||
Lithological features, lithology and surficial geology (soils) can be distinguished and mapped utilising a wide range of EO sensors and analytical techniques, often incorporating use of multiple EO datasets. Products include:
Products will vary according to specific user requirements and and are context (e.g. geographic scale and level of detail and accuracy) dependent. Spectral analysis is an established key tool utilising spectral signatures of surface materials (using a variety of techniques including band-combination, band-ratio and PCA). Litho-types can be distinguished by spectral signature (of outcrop and/or vegetation) together with relationships with topography/geomorphology, in particular texture (surface roughness) and pattern (including drainage pattern). Altered rocks and soils (e.g. ferric iron alteration enrichment and clay mineral alteration) associated with onshore hydrocarbon seepage can provide important clues for basin geological modelling and exploration. Multispectral analysis techniques use reflected infrared (VNIR, MIR) and thermal (emitted) wavelengths measured from a wide variety of sensors at different resolutions. Landsat and ASTER are widely utilised. Data fusion between different sensors and other datasets including DEM and geophysics allow for improved interpretation and lithological classification. In addition to identification of broad litho-type groups, further distinction and characterisation can be made by remote sensing analysis including stratigraphic relationships (between litho-types) and tectonic relationships to further enhance geological modelling of the project area. In combination with other EO products more applications are possible: Geomorphological analysis including DEM and shaded-relief analysis can be used to identify soils by geomorphic form such as fluvial deposits (river terraces, alluvial fans, deltas) and sand dunes. Surface roughness and moisture content can provide an indication of degree of weathering and soil formation. High resolution DEM (e.g., derived from VHR1 sensors) are beneficial for mapping geomorphic form related to surficial deposits. Multi-temporal analysis can provide information on mobility of surficial deposits such as mobile dunes and fluvial (river/delta) systems. Hyperspectral data can allow for distinction of finer levels of detail of spectral class and mineral identification allowing for more precise lithological differentiation, including variation within a formation unit (e.g., due to facies change, intrusions such as dykes and sills, hydrothermal alteration, weathering, duricrusts and hydrocarbon seepage). Future planned hyperspectral sensors, including EnMAP (2017), are anticipated to have good potential for lithological mapping. Airborne geophysics data can be effectively incorporated with EO data analysis when the EO-based product is not detailed and accurate enough for the lithological application. Spaceborne geophysics data currently is not at sufficient resolution to allow for detailed lithological distinction. Data collected from the GOCE satellite (2009-2013) has some benefit for mapping of global and broad regional scale geological structures including mapping depth of crust (depth to Moho) for input to broad regional seismic and tectonic modelling, including thermal gradient modelling. | ||||||||
Known restrictions / limitations | ||||||||
| ||||||||
Lifecycle stage and demand | ||||||||
Exploration | Environmental Assessment and Permitting | Design, Construction and Operations | Mine Closure and Aftercare | |||||
| ■■■ |
| ■ |
| |||||
Exploration: Exploration companies need to know the mineral composition of the area they are exploring, in other words what is the actual concentration of the metal or mineral of interest. The area to be mapped geochemically will change depending on the outcomes. For exploration a combination of lithology mapping and soil chemistry is desirable. Various measurement resolutions are required depending on metal / mineral of interest. Typically zinc-bearing and copper-bearing minerals are of interest. As confidence builds in the presence of a significant, minable, resource it will be necessary to get better definition of the minable element to firstly establish the mining reserve, and secondly develop a mining schedule to abstract the reserve. Design, Construction &Operations: Information for planning and design of infrastructure, to support site selection. Monitoring of changes in lithology/soils for asset monitoring of facilities. | ||||||||
Geographic coverage | ||||||||
Coverage is global, except for the polar regions. | ||||||||
EARSC Thematic Domain | ||||||||
Domain | Land | |||||||
| Sub-domain | Geology | |||||||
| Product description | Monitor mineral extraction | |||||||
PRODUCT SPECIFICATIONS | ||||||||
Input data sources | ||||||||
| Satellite | Landsat 8 | Sentinel-2A | ASTER | EnMAP | GOCE | |||
| Status | In operation | In operation | In operation | Future | Not in service | |||
| Operator | NASA | ESA | NASA | DLR | ESA | |||
| Data availability | Public | Public | Mostly public. | n/a | Public | |||
| Resolution (m) | Depending on spectral band (15-100 m) | Depending on spectral band (10-60 m) | Depending on spectral band (15-90 m) | 30 m | 100 km | |||
| Coverage | Global | Global | Global | Global | Global | |||
| Frequency (days) | 6 days | 5 days | 16 days | 4 days | 16 days | |||
| Launch year | 2013 | 2015 | 1999 | 2020 | 2009-2013 | |||
Website | link | link | link | link | link | |||
| Supporting data from Geological maps, published literature and reports, Field geological mapping, borehole logs and airborne geophysics might me necessary. | ||||||||
Minimum Mapping Unit (MMU) | ||||||||
n/a (the product is directly based on the input data; which in general varies from 10 m-100 km (see above). | ||||||||
Accuracy / constraints | ||||||||
Thematic accuracy: Geology – Monitor mineral extraction: 19% for arid/semi-arid regions where vegetation is low. For geochemical mapping a combination of lithology mapping and soil chemistry is needed. Lithology can give information about the potential elements, but information about the soil chemistry is needed to get information about the exact mineral composition of the metal elements. Spatial accuracy: See above. For exploration lithology mapping is usually necessary at a regional (~1000 km2) to local (~10 km2) scale. For ore body definition a resolution down to 15 m x 15 m is needed. | ||||||||
Accuracy assessment approach & quality control measures | ||||||||
A quality control measure includes professional judgement and by comparison with any published geological mapping/reports or ground truth data (geological mapping and collection of field spectra, borehole logs). | ||||||||
Timeliness | ||||||||
Generally, for the client annually updated maps are necessary. | ||||||||
Availability | ||||||||
Data is typically freely available for non-commercial use through the open data policy of the different space agencies. See for an overview of the used satellites the table above. | ||||||||
Delivery / output format | ||||||||
Typically, the datasets are delivered in raster NetCDF format, TIFF or vector shapefiles. | ||||||||
USE CASE | ||||||||
Geological mapping in Africa using Sentinel 1 and 2 and SRTM data (Source: ESA) The traditional way of mapping geology and mineral resources is a costly and time-consuming undertaking. Satellites can support this challenge. This ESA-funded effort by the German geo-information company GAF to support the African Mineral Geoscience Initiative. The aim of initiative is to catalogue Africa’s geology and mineral resources. Here they used the freely available data from Copernicus Sentinel 1 & 2, as well as data by SRTM and US WorldView-3. Arid and semi-arid areas can be mapped this way, however areas with (dense) vegetation (e.g. tropical areas) are more difficult to map. | ||||||||

This page has no comments.