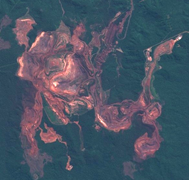
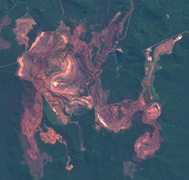
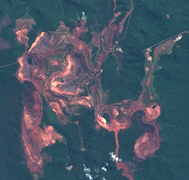
Land disturbed by mining acitivites | ||||||||
Observations (July 2016, 2017 and 2019) of mining activities at the Carajas mine, Brazil (source: Sentinel-2). | ||||||||
PRODUCT DESCRIPTION | ||||||||
Category | ||||||||
|
| |||||||
Uses | ||||||||
Environmental Assessment & Permitting:
Design, Construction & Operations:
Mine Closure & Aftercare Continuous monitoring of the rehabilitation of land disturbed by mining activities | ||||||||
Challenges addressed | ||||||||
| ||||||||
Geo-information needs | ||||||||
| ||||||||
Description | ||||||||
The product reports (for a given area) the land disturbed by the mining operators during the construction and operational phases. By comparing two or multiple satellite images (optical imagery products) acquired at different times, both the mapping and mining authorities can control whether the conducted mining activities are nominal. By combining manual or automatic inspection of those images and the use of a Geographical Information System (GIS) program, vector layers can be generated to delimit the land disturbed by mining activities and investigate the evolution of the land cover throughout the construction and operation phases. Moreover, infrared and optical imagery products can also be coupled (i.e., by making ratios of images taken at different wavelengths) to quantify how the vegetation within and around the mining site have been disturbed (via for example the generation of vegetation index map products). | ||||||||
Known restrictions / limitations | ||||||||
| Cloud coverage might be an issue if a high-resolution land use/cover evolution (in time) is needed. The magnitude of such limitation is dependent on the geography and climate of the mining site as well as the season. | ||||||||
Lifecycle stage and demand | ||||||||
Exploration | Environmental Assessment and Permitting | Design, Construction and Operations | Mine Closure and Aftercare | |||||
■■ | ■■■■ | ■■ | ||||||
Geographic coverage | ||||||||
| Demand and coverage are global. | ||||||||
EARSC Thematic Domain | ||||||||
Domain | Land | |||||||
| Sub-domain | Land use | |||||||
| Product description | Monitor land cover and detection change | |||||||
PRODUCT SPECIFICATIONS | ||||||||
Input data sources | ||||||||
| Satellite | Sentinel-2 | Landsat-8 | GeoEye-1 | Worldview-1, 2 and 3 | SPOT 6, 7 | Pleiades | ||
| Status | In operation | In operation | In operation | In operation | In operation | In operation | ||
| Operator | ESA | NASA | Digital Globe | Digital Globe | Airbus | |||
| Data availability | Public | Public | Commercial | Commercial | Commercial | Commercial | ||
| Resolution (m) | 10 - 60 | 15 - 100 | 0.46 | 0.31-0.46 | 1.5 | 0.5 | ||
| Coverage | Global | Global | Global | Global | Global | Global | ||
| Frequency (days) | 5 | 16 | < 3 | < 2 | < 1 | < 1 | ||
| Launch year | 2015 | 2013 | 2008 | 2007/2009/2014 | 2012/2014 | 2011 | ||
Website | link | link | link | link | link | link | ||
NOTE: Airborne and drone imagery products (optical and infrared) for local and regional analysis might also be used in order to obtain higher image resolution. NOTE 2: Most of the satellite operator provide images under raster type of formats such as “.tif” files. Satellite products are often gathered into a single product containing several bands (i.e., images obtained at different wavelengths). | ||||||||
Minimum Mapping Unit (MMU) | ||||||||
Minimum detectable feature size (dependent on the input pixel resolution, ~1 - 3 px) | ||||||||
Accuracy / constraints | ||||||||
Thematic accuracy: >85% threshold for overall accuracy / class accuracy. Spatial accuracy: Dependent on the input pixel resolution; typically, ~0.5 - 1 pixel. | ||||||||
Accuracy assessment approach & quality control measures | ||||||||
Dependent on the input pixel resolution; typically, ~0.5 - 1 pixel. | ||||||||
Frequency / timeliness | ||||||||
Digitization of land disturbed by mining activities from imagery products can be completed within a few hours/days of work, dependent on how large the area disturbed by mining activities is. To tie in with corporate reporting, monthly assessment and reporting would be required. | ||||||||
Availability | ||||||||
Data from Sentinel satellites are freely available through the open data policy of the European Space Agency. Data is made available typically within 6-12 hours of satellite fly-over (similar for Landsat through NASA open data policy). GeoEye-1, Worldview, SPOT and Pleiades data are commercially licensed and must be purchased through operator/vendor. Usually available within hour(s) of satellite fly-over. Airborne and drone imagery products can be purchased through operator/vendor. Usually available within hours or days after acquisition. | ||||||||
Delivery / output format | ||||||||
Mining activities Overview map of mining activities (and evolution in time) Output: vector formats - shapefile, report on key indicators, client-specified spatial formats Land cover (land disturbed) Overview map of land disturbed by mining activities Output: raster formats - GeoTiff, report on key indicators, client-specified spatial formats | ||||||||
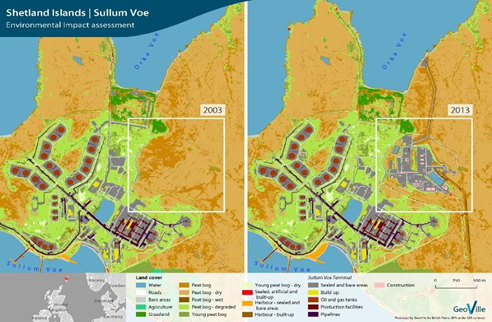
USE CASE | ||||||||
Source: GeoVille Shetland Islands – Environmental impact assessment The aim of this project was to support environmental impact assessment and to provide guidance to minimize ecological impacts and to value ecosystem services in the region. A detailed very high-resolution land cover and land use classification was provided. The examples were used to identify valuable ecosystem services, to recognize ecosystem services dependencies and the impact caused by the operations. This method may also be applied to monitor mining activities and the land disturbed by them. | ||||||||
This page has no comments.