Land Use Mapping | ||||||||
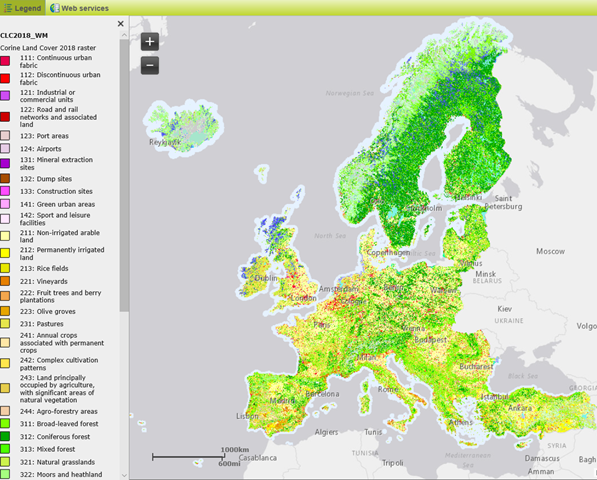
Corine Land Cover based on Landsat data (Source: The European Environment Agency EEA) | ||||||||
PRODUCT DESCRIPTION | ||||||||
Category | ||||||||
|
| |||||||
Uses | ||||||||
| ||||||||
Challenges addressed | ||||||||
| ||||||||
Geo-information needs | ||||||||
| ||||||||
Description | ||||||||
Land use maps describe not only the physical characteristics of the Earth’s surface (land cover), but also the actual anthropogenic usage on the ground. The product differentiates basic land cover types (e.g. built-up areas) into different use classes, such as residential areas, industrial complexes, roads, buildings, or cropland. Land use maps can be created from optical or radar satellite data, but often require additional reference information to characterise the actual land use (e.g. if vegetated areas are grown naturally or under a crop rotation cycle). Features can be extracted from the data and converted to GIS vector formats. The precision and detail of land use information is dependent on the input data resolution. This is especially relevant for features such as roads, buildings and other structures in order to perform GIS analyses or to update existing map data. The product provides mapping of urban areas in terms of land cover and land use, as well as the associated temporal changes based on high to very high resolution optical or radar satellite data. Land use cannot be clearly extracted from satellite data in a direct way. That means some forms of utilisation must be derived with the help of multi-temporal analysis, like agricultural areas for example, whilst extraction of road features depends on visual interpretation. For precise land use information additional in-situ information are mandatory. Whilst medium resolution satellite data with a resolution of 100 meters and below is used to generate overview maps on regional scale (1:1.000.000 and smaller), high (up to 10m) and very high resolution data (up to 1m and below) is used to generate detailed land use maps at the licence/project scale of up to 1:5.000). In the case of building inventories, only part of the building information can be captured, depending on the sensors used for data acquisition. Very high resolution optical sensor imagery makes it possible to estimate building footprints, building location, distance from building to building, building height classes (using stereo image pairs). Other features, such as building height as number of storeys, building material, structure type, load bearing structure system, construction technique, floor area, are more difficult to capture or must be inferred from other contextual information. Using multi-temporal image information, the product is particularly relevant for monitoring urban expansion. Furthermore, the products serve as a starting point for a range of urban indicators for soil protection and management as well as the monitoring of crucial water supply systems, urban structures, and flood risk control. Examples of use include the following:
Based on this, the product can provide various urban indicators, as well as infrastructure and building inventories based on construction classes. Typical artificial surface land cover/use classes used in the classification follow the established nomenclatures (CORINE (Sentinel-2 and Landsat-8), MOLAND, FAO LCCS, ESA Land Cover CCI, etc..). While the EO products rarely achieve the accuracy of cadastral data, their accuracies are sufficiently high to form an objective basis for decision-making and enable continuous monitoring over time. | ||||||||
Known restrictions / limitations | ||||||||
A potential limitation of urban and settlement mapping is a high presence of cloud coverage within the analysis region, as optical satellite data is not capable of penetrating clouds. Potential approaches mitigating this issue could be: 1) combining optical and VHR SAR data as they are able to penetrate cloud coverage; 2) using VHR SAR stereo data to produce a nDSM (normalized Digital Surface Model) to support optical classification. Urban and settlement mapping is also limited by the resolution of the input data used. Structures smaller than double the resolution of the input data cannot be mapped. | ||||||||
Lifecycle stage and demand | ||||||||
Exploration | Environmental Assessment and Permitting | Design, Construction and Operations | Mine Closure and Aftercare | |||||
| ■ | ■■■■ | ■■ | ■■ | |||||
General: For all stages of the lifecycle it is necessary to understand land usage to understand the baseline condition of the land where mining is planned and to assess what the impact of mining might be and what the rehabilitation criteria might be. Environmental Assessment & Permitting: Mining companies need to understand what impact they may have on people that live near the mine. A mine needs to understand where it can source workers and raw materials. For its employees it needs to know what resources are available from a recreational and accommodation perspective. Due to the nature of the industry there may be disturbance due to noise or blast vibration and this needs to be assessed and understood with respect to local population centres. Mining also brings a lot of significant social benefits and it is important for the mining company to be able to demonstrate what positive benefit it can bring to an area in terms of infrastructure and jobs. Population changes do not take place very quickly and therefore an annual update would be sufficient to detect changes in population. Furthermore, it is necessary to understand land usage (e.g. livestock, arable crops, forestry etc.) to understand the baseline condition of the land where mining is planned and to assess what the impact of mining might be and what the rehabilitation criteria might be. The area to be assessed for usage will depend on the area of land that may be impacted by the mining operation and will be in the order of 10 km2 to 100km2. Land usage will not change greatly over short time periods. Therefore, from a permitting perspective, it is necessary to carry out this assessment on only one occasion prior to commencement of the mining project. Any follow up assessment may be completed at a frequency of c. every 6 months to allow for changes due to crop rotation. | ||||||||
Geographic coverage | ||||||||
| Coverage is global. | ||||||||
EARSC Thematic Domain | ||||||||
Domain | Land | |||||||
| Sub-domain | Land use | |||||||
| Product description | Measure Land Use statistics | |||||||
PRODUCT SPECIFICATIONS | ||||||||
Input data sources | ||||||||
| Satellite | Sentinel-2 | Landsat-8 | Worldview-1, 2 and 3 | |||||
| Status | In operation | In operation | In operation | |||||
| Operator | ESA | NASA | Digital Globe | |||||
| Data availability | Public | Public | Commercial, on demand | |||||
| Resolution (m) | 10-60 | 15-100 | 0.31-0.46 | |||||
| Coverage | Global | Global | Global | |||||
| Frequency (days) | 5 | 16 | < 2 | |||||
| Launch year | 2015 | 2013 | 2007/2009/2014 | |||||
Website | link | link | link | |||||
NOTE: Airborne and drone imagery products (optical and infrared) for local and regional analysis might also be used in order to obtain higher image resolution. NOTE 2: Most of the satellite operator provide images under raster type of formats such as “.tif” files. Satellite products are often gathered into a single product containing several bands (i.e., images obtained at different wavelengths). | ||||||||
Minimum Mapping Unit (MMU) | ||||||||
n/a (the product is directly based on the input data; the smallest unit is 1 pixel). | ||||||||
Accuracy / constraints | ||||||||
Thematic accuracy: Land Use – Measure Land Use statistics. 80% Spatial accuracy: See above. Required accuracy in the mining sector is often for large areas at a relatively high spatial resolution. | ||||||||
Accuracy assessment approach & quality control measures | ||||||||
This is done by field validation using in-situ measurements. | ||||||||
Frequency / timeliness | ||||||||
Observation frequency: Every one or more days, depending on satellite. Timeliness of delivery: Within five (working) days of sensing. | ||||||||
Availability | ||||||||
Data is typically freely available for non-commercial use through the open data policy of the different space agencies. See for an overview of the used satellites the table above. | ||||||||
Delivery / output format | ||||||||
Typically, the datasets are delivered in HDF5, NetCDF, binary or in shapefiles. | ||||||||
| USE CASE | ||||||||
Source: CORINE land cover (CLC) inventory (Copernicus, Land Monitoring Service) Within the Copernicus Land Monitoring Service the CORINE Land Cover (CLC) inventory was developed using different satellite observations (including Landsat-5/7/8, SPOT-4/5, IRS, and Sentinel-2) with land cover monitoring from 1990, 2000, 2006, 2012 and 2018. Changes have been detecte with a minimal mapping unit (MMU) of 5 hectares (ha). | ||||||||

This page has no comments.