Hydrological Network and surface water dynamics | ||||||||
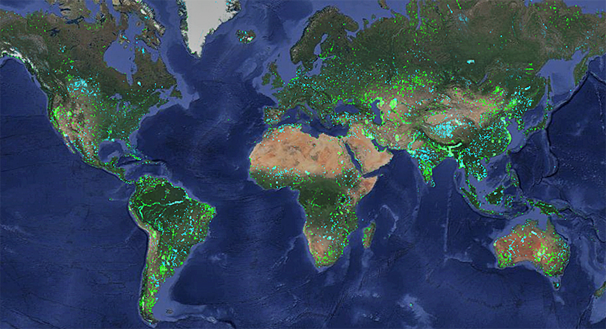
Screenshot of the Deltares Aquamonitor showing changes in surface water dynamics (Source: Deltares) | ||||||||
PRODUCT DESCRIPTION | ||||||||
Category | ||||||||
|
| |||||||
Uses | ||||||||
| ||||||||
Challenges addressed | ||||||||
| ||||||||
Geo-information needs | ||||||||
| ||||||||
Description | ||||||||
This product provides information on the hydrological network and the catchment area by combining various types of topographic data (elevation, slope gradient and direction). Thus, the current and future, hydrological driven, utilization potential of the surrounding land based on satellite data can be estimated. Furthermore, information on the hydrological network and catchment area helps to identify potential areas of flooding. A hydrologically correct elevation data set is generated by ensuring that surface features such as vegetation and buildings are removed and filling unwanted or incorrect sinks within the elevation data. The elevation data is used to calculate the direction of water flow for each pixel of the input data. This flow direction information is used to calculate accumulated overland flows, which are used to derive hydrological networks (streams/ watercourses). Further GIS operations are generally used to generate a hydrological network with stream orders (e.g. Horton-Strahler stream order). Streams can be defined by the number of cells draining into one cell. This information is used to delineate catchment and sub-catchment areas. This product delivers maps or vector or raster digital files that delineate and identify:
These products can be used as an input for hydrological modelling, to derive e.g. sheet flows on plains or for modelling of potential flood areas for flood risk assessment. Detection of water bodies from space is done by radar or optical imagery. Surface water change detection has been done where by combining different data sources over 30 years of annual surface water can be detected. One way is by merging Landsat observations from different missions in google earth engine resulting in Aquamonitor. Another surface water change product has been developed by JRC in the Global Surface Water Explorer. | ||||||||
Known restrictions / limitations | ||||||||
The main input for this integrated product is an elevation model, which can be based on radar or optical data. By using optical data a higher resolution can be achieved (there are more and higher resolution optical VHR sensors than radar sensors), but the restrictions of optical data concerning cloud coverage in areas with high cloud cover (e.g. inner tropics) have to be considered. Furthermore, high latitudes coverage is restricted. When generating a digital elevation model (DEM) from stereo pairs, good quality imagery needs to be available with 2 or more images showing the same area from different directions. This can be a time-consuming process. Lower resolution DEM data is available off the shelf. An important issue is that the DEM is used to estimate surface flows, and in many regions the hydrology is heavily influenced by geology and surface flows, particularly in sedimentary geological regions (e.g. Karst). Other options are using on the shelf integrated products as listed and specified under Product Specifications | ||||||||
Lifecycle stage and demand | ||||||||
Exploration | Environmental Assessment and Permitting | Design, Construction and Operations | Mine Closure and Aftercare | |||||
| ■ | ■■■■ | ■■ | ■■ | |||||
General: Water is a key aspect of mining. Mining will typically take place over a very large footprint and will have a large area of influence. Mining companies need to identify the water catchment and they need to understand what impact they may have on that catchment in terms of discharging into it Environmental Assessment & Permitting: The mining company needs to know where the locations of surrounding water bodies are and to know where mining might cause an impact (e.g. flooding). They also need to understand how abstracting (ground)water from the mine site might impact on the water balance within the catchment and potentially deprive sensitive areas of water. Also, the catchments need to abstractions and discharges from the mine site. Design, Construction & Operations: During operations mining companies need to monitor their emissions of pollutants in the environment. An indirect, supporting parameter is the quantity of water where the dissolved components could possibly be in. Mine Closure & Aftercare: During mine closure and aftercare operators need to implement a good closure protocol preventing potential leaks or seepage. Detection of change in open water bodies could support whether floods (dam breaches) occur or chemicals are possibly emitted in the environment through seepage/overland flow. | ||||||||
Geographic coverage | ||||||||
| Coverage is global | ||||||||
EARSC Thematic Domain | ||||||||
Domain | Land | |||||||
| Sub-domain | Inland water | |||||||
| Product description | Assess and monitor water bodies | |||||||
PRODUCT SPECIFICATIONS | ||||||||
Input data sources | ||||||||
| Satellite | HydroSheds (Catchments and river networks) | Global Reservoirs and Dams (GRanD | Global Lakes and Wetlands Database (GLWD) | Aquamonitor (Surface Water Change) | Global Surface Water Explorer (Surface Water Change) | |||
| Status | In operation | In operation | In operation | In operation | ||||
| Operator | USGS | Global Water System Projet | WWF | Deltares/Google Earth Engine | JRC | |||
| Data availability | Public | Public | Public | Public | Public | |||
| Resolution (m) | 500 m | n/a | 1:1 – 1:3 million | 30 m | 30 m | |||
| Coverage | Global | Global | Global | Global | Global | |||
| Frequency (days) | n/a | n/a | n/a | annual | annual | |||
| Launch year | 2008 | 2011 | n/a | 1985-2016 | 1985-2020 | |||
Website | link | link | link | link | link | |||
Minimum Mapping Unit (MMU) | ||||||||
n/a (the product is directly based on the input data; the smallest unit is 1 pixel). | ||||||||
Accuracy / constraints | ||||||||
Thematic accuracy: Inland Water – Assess and monitor water bodies. 80% For the mining industry the catchments and hydrological networks are relevant. As well as the changes in surface water over time. This product, however, as result of its relatively coarse spatial resolution, mostly be used as supporting data product for monitoring routine water emissions or tracing of leaks after closure of mining activities. Spatial accuracy: See above. Required accuracy in the mining sector for detection of leaks and plumes in m-scale resolution, which is not available with the current available products. For the detection of catchments and hydrological networks the existing product resolution is sufficient | ||||||||
Accuracy assessment approach & quality control measures | ||||||||
This is done by field validation using in-situ measurements. | ||||||||
Frequency / timeliness | ||||||||
n/a | ||||||||
Availability | ||||||||
| Data is typically freely available for non-commercial use through the open data policy of the different space agencies. See for an overview of the used satellites the table above | ||||||||
Delivery / output format | ||||||||
Typically, the datasets are delivered in raster NetCDF format, TIFF or in shapefiles | ||||||||
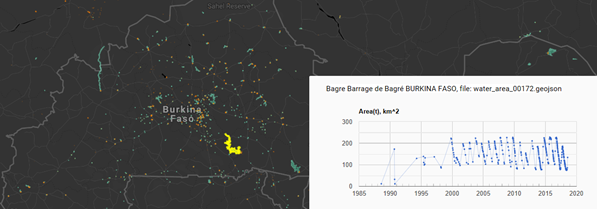
USE CASE | ||||||||
Source: Deltares Surface water dynamics of dam reservoirs can provide insight into the dynamics of water over time. In the picture above the orange dots show all the known dam locations, in blue/green the water reservoirs are shown. In the graph the EO observed changes of surface water over time are shown based on the Deltares Aquamonitor. | ||||||||
This page has no comments.