Air quality CO2 | ||||||||
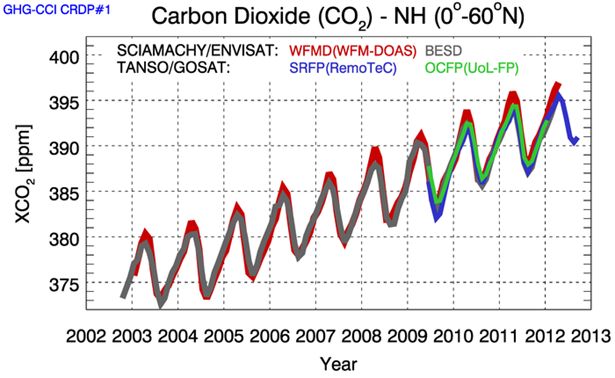
Satellite observed variability in XCO2 concentrations over time (source: University Bremen/ESA) | ||||||||
PRODUCT DESCRIPTION | ||||||||
Category | ||||||||
|
| |||||||
Uses | ||||||||
| ||||||||
Challenges addressed | ||||||||
| ||||||||
Geo-information needs | ||||||||
| ||||||||
Description | ||||||||
This product provides information on atmospheric carbon dioxide (CO2) – one of the most important greenhouse gases that contribute to global warming. Space-based remote sensing of the CO2 column-average dry air mole fractions (XCO2) has the potential to provide observed global constraints on CO2 fluxes across the surface-atmosphere boundary and to provide insight into the related biogeochemical cycles. XCO2 products retrieved from these satellites have been validated with reference to high-resolution ground-based Fourier Transform Spectrometers (g-b FTS) data and model data. The Japanese Greenhouse Gases Observing Satellite, GOSAT, is the first satellite designed specifically for this application. GOSAT has been collecting CO2 and methane (CH4) observations over the sunlit hemisphere since April 2009. These data are beginning to yield new insights into the carbon cycle. Furthermore, in July 2014 NASA launched the second satellite dedicated to the measurement of CO2- the Orbiting Carbon Observatory-2 (OCO-2). The OCO-2 satellite is being operated by NASA’s Jet Propulsion Laboratory and its stated mission objective is to “Collect the first space-based global measurements of atmospheric CO2 with the precision, resolution, and coverage needed to characterize its sources and sinks on regional scales and quantify their variability over the seasonal cycle”. The spatial resolution of these instruments is relatively low (GOSAT: ~ 1 x 1 km2; OCO-2: ~ 1.5 x 2.5 km2). The major focus of both of these missions is the determination of the global CO2 burden and its regional variations. OCO-3 is launched in May 2019 and will follow up on the OCO-2 observations onboard the International Space Station (ISS). GOSAT-2 has been launched in 2018 and the expected release of data is in 2019. In contrast, the first mission dedicated to the high-resolution measurement of CO2 and CH4 emissions from space is the commercial satellite GHGSat, which was launched in 2015. GHGSat spatial resolution is 50 x 50 m2, within a ground footprint of 10 x 15 km2. This allows high precision mapping of emissions from identified target sources as opposed to obtaining averages over large areas. Their demonstrator satellite could detect modest leaks from individual wells. Additionally to the satellite observations there are airborne observations that complement EO-based data within the Active Sensing of CO2 Emissions over Nights, Days & Seasons (ASCENDS) initiative. Furthermore the Space CARBon Observatory (SCARBO) aims at supplementing the existing products with observations by multiple nano-satellites. This will result in more accurate observations of CO2. The launch of these nano-satellites are planned to be in 2028. Other future initiatives include MicorCarb (CNES) that is expected to be launched in 2020 and GOSAT-3 (follow-up of GOSAt-2 with expected launch 2022). | ||||||||
Known restrictions / limitations | ||||||||
Spatial resolution of carbon dioxide retrievals from satellite-based EO are relatively coarse – native resolution of sensors on existing missions is approximately 4 km2 (OCO-2) to 75 km2 (GOSAT). Regional chemical transport models, used to assimilate the measurements of these missions have typical spatial resolutions ranging from 12 x 12 km2 to 3 x 3 km2. Future systems or commercial systems should provide improved retrievals. | ||||||||
Lifecycle stage and demand | ||||||||
Exploration | Environmental Assessment and Permitting | Design, Construction and Operations | Mine Closure and Aftercare | |||||
| ■ | ■■■■ | ■■ | ■■ | |||||
Environmental Assessment & Permitting: Mining companies need to understand what impact they may have on the air quality around the operation and what impact this air quality might have on people and the environment. As part of the permitting process it is necessary to establish what the baseline is, and to demonstrate that this will not be materially affected when mining operations are underway and when the mine is closed and rehabilitated. Sampling will be required over a wide area and will typically be governed by dispersion modelling. A 10 km2 area may be taken as typical for monitoring of ambient air for a mid-size mining operation. Within this 10 km2 area in the order of 10 to 20 sampling points may be established. There are sulphur (COx, NOx and SOx). Individual metal parameters within the air column can also be determined. The amount of particulate that falls out on to the ground can be measured on a per m2 basis (typically 'X' mg/ m2/day). Minimum levels of detection can be taken from 'Technische Anleitung zur Reinhaltung der Luft', which is a comprehensive document issued by the German government, which describes air quality standards. This document, commonly referred to as the 'TA Luft', is used by many countries and organisations as a reference for air quality. Design, Construction & Operations: Mining operations will have point source air emissions from ventilations shafts, processing plants, labs, power plants etc. Measuring the quantity of different parameters emitted into the atmosphere (gaseous and solid) is an important aspect for mining companies to manage their potential environmental impact. Typical parameters are COx, NOx, SOx, Particulate, H2S. The area required to be assessed will be dependent on the footprint of the mining operation and could be 1 km2 to 10 km2. Air emissions can result in transboundary impacts on air quality beyond the site boundary. The extent of transboundary impact depends on the nature of the emission and also prevailing weather conditions and geographic features. Given the mobility of air emissions, an area of hundreds of km2 may need to be monitored. Air emissions will take place on a continuous basis. Many air emissions will be stable and infrequent measurement of monthly to quarterly will be sufficient. Other emissions will be more variable and subject to disruption, these would ideally be measured on a continuous basis. In addition to point source air emissions, mines will have significant fugitive air emissions, these can be plumes from pit blasts, dust from vehicular movement, dust blow off TSF / WRD, and fires. Monitoring for fugitive emissions is an important aspect for mining companies to manage their potential environmental impact. This fugitive monitoring can also be used to identify sources of emission and implement corrective actions (including identifying spontaneous combustion fires and arrange to have these extinguished). The frequency required for monitoring this parameter is site specific. In many instances monthly would be sufficient but in particular for the identification of spontaneous combustion continuous monitoring would be of benefit Mine Closure & Aftercare: Monitoring will be required during the closure and aftercare period to demonstrate that there are no ongoing air emissions from the site that could cause an impact. Point sources will no longer be operational. The focus will be on fugitive emissions from WRD's and TSF's. Assessment of this parameter will involve field work including measurement of air quality for various parameters and measurement of particulate fallout. Depending on climatic conditions air emissions can travel long distances. The area to assessed can be hundreds of km2. Monthly data is sufficient, this can be used to calculate daily deposition rates | ||||||||
Geographic coverage | ||||||||
| Coverage is global | ||||||||
EARSC Thematic Domain | ||||||||
Domain | Atmosphere and Climate | |||||||
| Sub-domain | Atmosphere | |||||||
| Product description | Monitor Air Quality and Emissions | |||||||
PRODUCT SPECIFICATIONS | ||||||||
Input data sources | ||||||||
| Satellite | GOSAT | OCO-2 | GHGSAT | SCARBO | MicoCarb | |||
| Status | Operational | Operational | Operational | Planned | Planned | |||
| Operator | JAXA | NASA-JPL | GHGSAT | Airbus | CNES | |||
| Data availability | Public | Public | Commercial | n/a | Public | |||
| Resolution (m) | 1 km | 1.5x2.5 km | 50 m | n/a | 2x2 km | |||
| Coverage | Global | Global | Target anywhere globally | Target anywhere globally | Global | |||
| Frequency (days) | 3 days | 16 days | n/a | n/a | 16 days | |||
| Launch year | 2009 | 2014 | 2016 | 2030 | 2022 | |||
Website | link | link | link | link | link | |||
| Archived satellite products include the ENVISAT SCIAMACHY sensor. | ||||||||
Minimum Mapping Unit (MMU) | ||||||||
n/a (the product is directly based on the input data; the smallest unit is 1 pixel). | ||||||||
Accuracy / constraints | ||||||||
Thematic accuracy: Atmosphere– Monitor Air Quality and Emissions. 80% For the mining industry the targeted nano-satellites probably are the most suitable source of information, because emissions from water plumes can be very low. Probably the emissions caused by mining activities won’t cross the threshold in background values of the larger satellites. Spatial accuracy: See above. Needed accuracy in the mining sector is often for large areas in relatively high spatial resolution. | ||||||||
Accuracy assessment approach & quality control measures | ||||||||
This is done by field validation using in-situ measurements. | ||||||||
Frequency / timeliness | ||||||||
n/a | ||||||||
Availability | ||||||||
| Data is typically freely available for non-commercial use through the open data policy of the different space agencies. See for an overview of the used satellites the table above. | ||||||||
Delivery / output format | ||||||||
Typically, the datasets are delivered in HDF5, NetCDF, binary or in shapefiles. | ||||||||
USE CASE | ||||||||
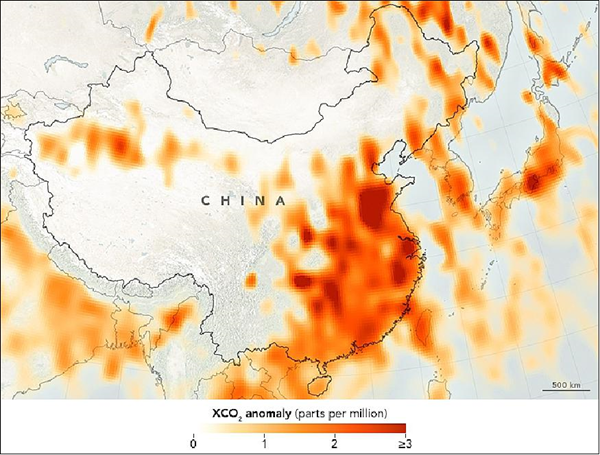
Source: NASA Earth Observatory, maps by Joshua Stevens, using OCO-2 anomaly data CO2 observations based on observations from OCO-2 revealing major anthropogenic sources of CO2, as shown for example here in this figure over Eastern China (Hakkarainen, 2016). Other regions include Europe and USA and individual cities. | ||||||||
This page has no comments.