After BP's Deepwater Horizon accident in April 2010, crude oil was expelled, affecting the marine and onshore environment, as well as the marine dependent economy throughout the Gulf. Afterwards, the controversy over the use of dispersants, the fate of the oil and the impact on the marine environment as well as on the economy in the Gulf of Mexico (GOM) made clear that technology for effectively monitoring, documenting and analysing the oil spill dynamics as well as an assessment of its interaction with natural habitats was urgently needed.

GeoVille, specialized in the development and application of state of the art satellite remote sensing and Geographic Information System (GIS) based spatial analysis techniques, was contracted to establish the first full spatial chronology of the Deepwater Horizon accident oil spill evolution and the identification as well as quantification of its site impacts. The impact mapping supported an effective and fast response management in order to minimize the consequences for coastal and marine habitats in the Gulf of Mexico.

BP has been operating in the Gulf of Mexico since 1950 and is exploring its Deepwater Horizon for more than a quarter of a century. Over the last 10 years, BP has become the largest investor in the Gulf of Mexico.

In April 2010, the explosion and sinking of BP's Deepwater Horizon oil rig caused an estimated 800 Million litres of crude oil to be expelled into the Gulf of Mexico. The dynamic nature of the changing marine environment surrounding the Deepwater Horizon oil spill presented a challenge for management authorities and institutions involved in habitat protection. 

Figure 1: ENVISAT MERIS scene of 29 April 2010, displaying the oil spill in the Gulf of Mexico

For an effective and fast response management to the event on all levels of solution management, an up-to-date multi-source satellite-based documentation of the geographical and temporal impact of an oil spill on a variety of coastal and marine environments was required. Specifically, GeoVille provided a standardized documentation in digital maps and statistical form featuring:

  • Daily and weekly maps documenting the maximum extent of the oil spill and identifying site impacts of critical terrestrial and marine habitats of natural and economic value
  • Summary statistics and graphs quantifying area and sequences of oil interaction with terrestrial and marine habitats of natural and economic value
  • High resolution assessments for “hotspot” impact areas


The coupled approach of employing multi-source optical and radar satellite data (from various satellite systems) allowed for a timely, synoptic, consistent and precise mapping of the oil spill extent in the Gulf of Mexico. In particular radar satellite data were very suitable for the water surface oil slick mapping due to the strong absorbance of the radar signal by the oil slick. To derive a consistent chronology of the oil spill the custom mapping productions were combined with oil spill delineations made available through public identities to accumulate a complete database of the temporal oil slick coverages. These were analysed through a GIS to produce daily and weekly summary frequency maps depicting how often an area was covered by oil from the beginning to the end of the drilling hole opening. The accumulation of satellite-derived oil spill extents allowed identification and quantification of areas that have been affected hardest, on the ocean as well as on the coast (Figure 2).

To determine the oil interaction within coastal habitats, the cumulative weekly maps were intersected with coastal land cover data classified into habitats of particular interest. In this way, the length of the shoreline affected by the oil spill was identified for each land cover class, indicating also the frequency of oil contact. The resulting GIS database provided the basis for statistical analyses that were carried out for the affected shorelines in Louisiana, Mississippi, Alabama and western Florida.

Sea turtle nesting sites and Atlantic Bluefin Tuna (ABFT) habitat spawning index grids were intersected with the cumulative weekly oil spill maps to identify affected sites of this marine species of particular interest.
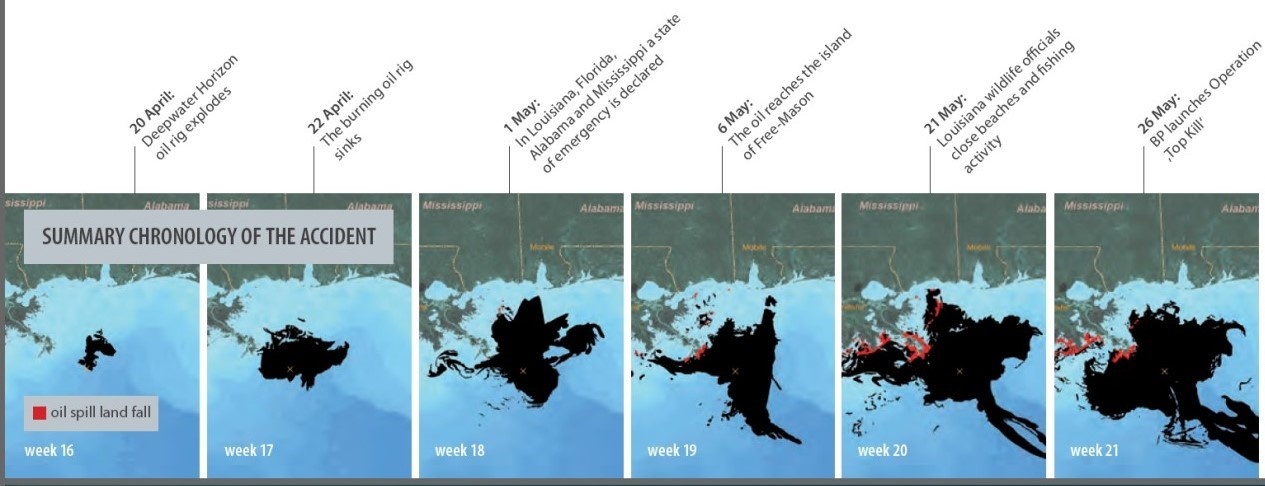
Figure 2: Summary chronology of the oil spill for 20 April  to 26 May 2010


Coastal land cover mapping:

To determine the oil interaction within coastal habitats, the cumulative weekly maps were intersected with NOAA Gulf Coast Land Cover data (http://www.csc.noaa.gov). This way, the length of the shoreline affected by the oil spill was identified for each land cover class, indicating also the frequency of oil contact. The resulting GIS database provided the basis for statistical analyses that were carried out for the affected shorelines in Louisiana, Mississippi, Alabama and western Florida (Escambia, Okaloosa, Walton, Santa Rosa, Bay, Gulf).

Atlantic Bluefin Tuna (ABFT) spawning habitat monitoring:

Atlantic Bluefin Tuna (ABFT) spawning stock in the western Atlantic has declined by >90% over the past 30 years. One of the management and conservation issues facing ABFT is the need to protect spawning grounds. To document the interaction of the oil spill with the ABFT spawning habitat, the ABFT spawning index was simulated and intersected with the evolution of the oil spill. Spawning habitat index (values from 0 – 1) is the measure of how favourable local environmental conditions [temperature, presence of food and absence of predators of larvae] are for the spawning of the species.

Sea Turtle nesting habitat monitoring:

Sea turtle nesting sites obtained from the State of the World`s Sea Turtles (SWOT) database (http://seaturtlestatus.org/) were intersected with the cumulative weekly maps to identify affected sites. Eroded nesting beaches are a major threat to sea turtle populations, together with destroyed foraging habitats and both chemical and physical effects from contact. Major oil spills affect sea turtles at all life stages and nearly all turtles coming in contact with an oil spill will die or become severely debilitated.

Oil slick summary frequency maps derived from satellite data depict for each area how often it was affected by the oil spill between 20 April and 29 August 2010. The continuous monitoring of the oil spill extent from space allowed the area covered by the oil spill to be estimated and the sites of landfall to be identified from the first week of the accident until the oil could no longer be monitored from space 19 weeks later.


Figure 3: The frequency of the oil spill derived from satellite data was intersected with coastal habitats from the Gulf Coast Land Cover.


Figure 4: The percentage of total shoreline affected by oil spill per habitat type in each state.


Impacts on coastal land cover:

Analysis of the satellite data and the shoreline land cover revealed that mainly unconsolidated shores, bare areas (i.e. beaches) and estuarine wetlands were affected by oil landfall in Louisiana, Mississippi, Alabama and western Florida. In Louisiana, for example, the percentage of affected wetland shorelines exceeded 15% (Figure 3 and 4). These habitats are home for many species and include important breeding sites and nursery grounds of marine animals, such as fishes, shrimps, sea turtles and birds.

Common straight-line distance assessments of the affected coastline revealed that approximately 167 km of the Gulf Coast shoreline experienced moderate to heavy oil impacts. Satellite technology allowed assessing the exact length of the affected shoreline, defined as the length of the edge of a body of water, thereby including all water boundaries of inlets, estuaries etc. This methodology revealed the fine scale impact and was used to gather the oil spill interaction information. To allow comparability of results with other impact assessments, the summaries of the presented key results were therefore provided in proportions of the affected shoreline versus the total length of the shoreline.

Atlantic Bluefin Tuna (ABFT) spawning habitat interaction:

Besides the impact on the coasts, marine species, such as the Atlantic Bluefin Tuna, were also affected by the oil spill. The spawning interaction with the oil spill resulted in an estimated reduction of Bluefin Tuna larvae greater than 20%. At the beginning of June 2010 (Week 23), the favourable habitat area concentrated in the spill area, resulting in a 100% impact. The abrupt change in the Middle June 2010 (Week 24) resulted from a drop of the spawning habitat index below 0.5 (everywhere) at the end of the spawning season (Figure 5 and 6).


Figure 5: Example map of spawning habitat index of Atlantic Bluefin Tuna in relation to the oil spill

Figure 6: Area of highly favourable spawning habitat impacted by the oil spill for the entire northern GOM (red bars) and within the US Exclusive Economic Zone alone (dotted line)

The case study demonstrated that large scale disasters can be efficiently monitored from space to identify most impacted areas. Multi-source satellite data allowed a timely, synoptic and precise mapping of the oil spill extent in the Gulf of Mexico. The intersection of satellite derived oil spill extents with various GIS datasets on valuable coastal and maritime habitats allows providing detailed information on the impacts of the oil spill on natural habitats, on the shoreline and in the GOM. The results derived in this study also highlight hot spot areas where increased restoration efforts were needed.

Necessary tools and processing chains to derive products for almost near real time and historical oils spill status and impact assessments were developed.

Contact

GeoVille is a private sector enterprise located in Austria and Luxembourg. GeoVille specialises in products and services related to Earth Observation (EO) and Geographic Information Systems (GIS) applications.

GeoVille is Europe’s leading company in using satellite data for land monitoring and spatial planning applications.

Our services provide the bridge from user needs to technical implementation - merging geospatial explicit data with statistics - to the analysis of what on-going processes and trends mean for real world applications.

GeoVille Information Systems GmbH

Sparkassenplatz 2, 3rd floor

A - 6020 Innsbruck

Austria

Email: info@geoville.com

Web: www.geoville.com