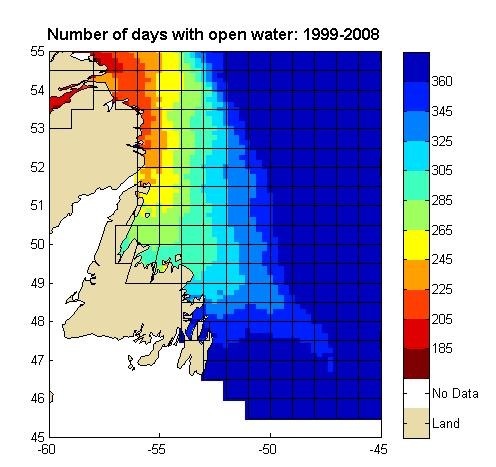
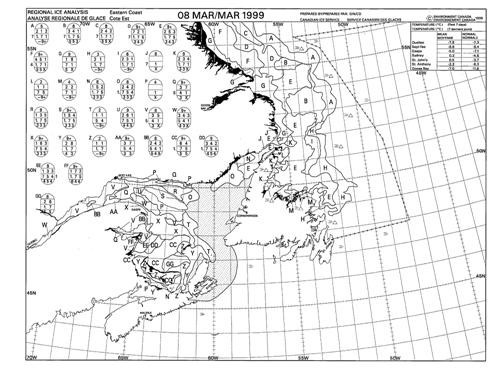
The following sample metocean results are derived from datasets that employ EO data, either as a primary data source, or as a data source that is used conjunction with other data types and methodologies. Example 1 presents a dataset were EO data plays a direct role. Figure 1 shows the average number of days of open water (i.e., the number of days when less than 1/10th concentration of sea ice is present) during the period 1999-2008 in the southern portion of the Labrador Sea. Ice free days are an important metocean parameter as they allow shipping and other operations to be carried out without a need for ice class vessels or structures. The dataset from which this plot was made was generated through the acquisition, aggregation and processing of hundreds of Canadian Ice Service charts, an example of which is show in Figure 2. 
Figure 1: EO derived dataset showing number of days with open water determined from a 10 year average of ice charts |

Figure 2: Sample Canadian Ice Service chart derived from EO data (© CIS 2014) |
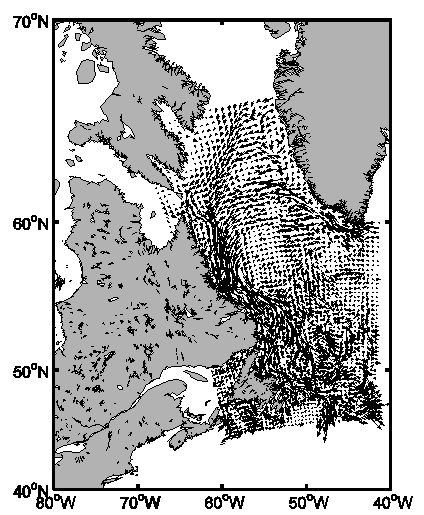
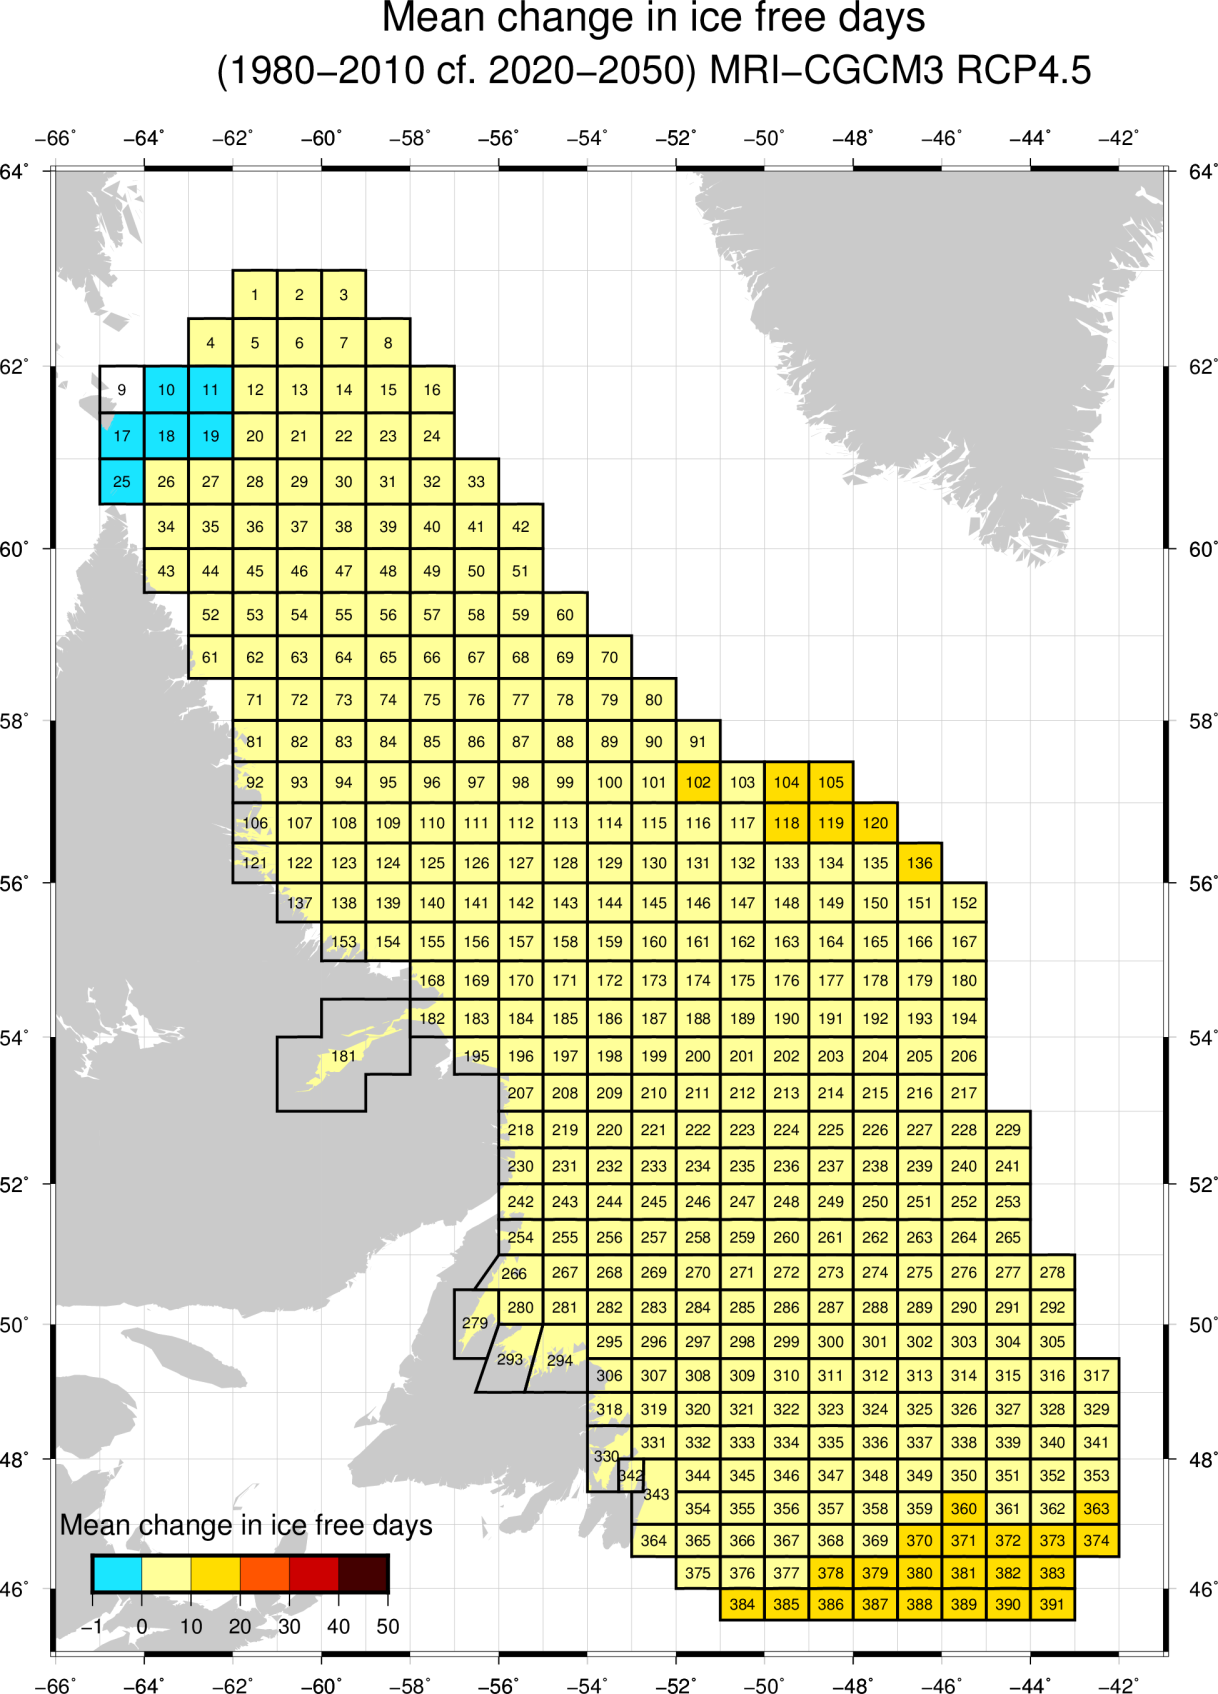
The CIS ice charts are produced from Synthetic Aperture Radar (SAR) Satellite Imagery satellite imagery and supported by ship and aircraft-based visual observations. They represent, on the chart publication date, the best estimate of ice conditions based on the integrated observational data. SAR data is an invaluable tool for this task because of the large spatial areas over which the satellite can obtain imagery and its ability to acquire data day and night in all weather conditions, clouds and fog being particularly problematic along the Labrador Coast. Example 2 presents an example of where EO observation plays an indirect but essential role. Figure 3 shows oceanographic surface current data from the Canadian East Coast Ocean Model (CECOM) model[1]. CECOM is a dynamically and thermodynamically coupled ice-ocean model developed and maintained by researchers at the Bedford Institute of Oceanography. The model has been employed in numerous studies including basin-scale and shelf circulations, operational ocean forecasting, and seasonal variation of ice cover. The spatial resolution of the model is 0.1 x 0.1 ° with a 21 level generalized σ (sigma) co-ordinate grid in the vertical; the data is produced at a 30 min resolution. Crucial to the development of model is the assimilation of the near real time satellite derived sea-surface temperature (SST) data; by incorporating the SST observations the accuracy of the model output is greatly increased improving the quality of the data that operators and designers require and rely on for design, planning, and operational purposes. Example 3 exploits the output from the Japanese Meteorological Research Institute Coupled General Circulation Model (MRI-CGCM3)[2], a 1.4o x 1.4o resolution earth systems model. Figure 4 shows the change, predicted by MRI-CGCM3, in the mean number of ice-free days between the period 1980-2010 and the period 2020-2050. The plot show that in the majority of locations the number of ice free days in a season will increase by up to ten days. The MRI-CGCM3 uses satellite derived altimeter data as part of its data assimilation scheme[3]. Again, by employing the satellite derived observational data the uncertainty in the model is greatly reduced, improving confidence in the results. MRI-CGCM3 is one of the models that is used in the Coupled Model Intercomparison Project Phase 5 (CMIP5)[4] experiments which, amongst other objectives, looks to provide a standard set of model simulations to evaluate how realistic the global climate models are in simulating the recent past and to provide projections of future climate change on near term and long term timescales. The role EO plays in deriving parameters such as sea surface temperature and sea surface height is essential in reducing the uncertainty of models such as CECOM and MRI-CGCM3 that are used to generate metocean datasets and analyses, both short term as operational forecasts and longer term as summaries and predications. 
Figure 3: Sample surface current output from the CECOM model for 03/01/2003 at 0200hr (CECOM model data kindly provided by the Bedford Institute of Oceanography) |
 Figure 4: Predicted change in ice free days from MRI-GCM3 |
|