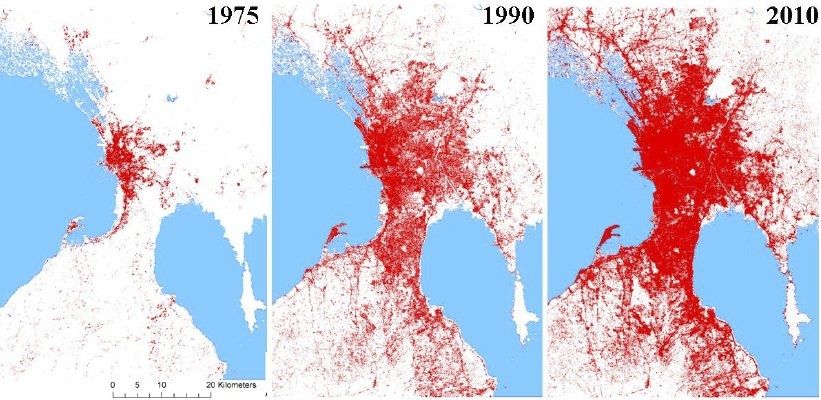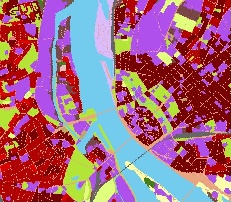

This capability provides mapping of urban areas in terms of type of land surface and the associated temporal changes (land cover and land cover change). Based on this, the services can provide various urban indicators, as well as infrastructure and building inventories based on construction classes. Typical artificial surface land cover classes used in the classification follow the established nomenclatures (CORINE, MOLAND, etc.), i.e. continuous and discontinuous urban fabric, industrial, commercial and public units, road and rail networks, port areas, airports, green urban areas, sport and leisure facilities, etc.
The spatial resolution of most products can reach a few meters depending on the input imagery resolution. Typically construction classes can be estimated at block level (MMU of 0.25 ha resulting in 1:10000 scale maps). Monitoring for the period from the late 1970s to the late 1990s relies mostly on medium resolution data which provide useful information to analyse spatial urban growth at regional level, for example differentiating between urbanised and non-urbanised areas. The temporal resolution (update frequency) is usually once every 1–5 years, but is limited only by the availability of satellite data (available globally every few days/weeks, depending on geographic latitude, cloud cover and data acquisition schedule).
 |  |
|
|---|---|---|
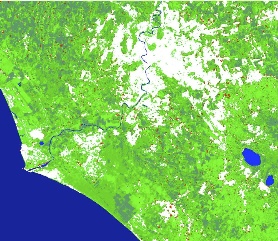
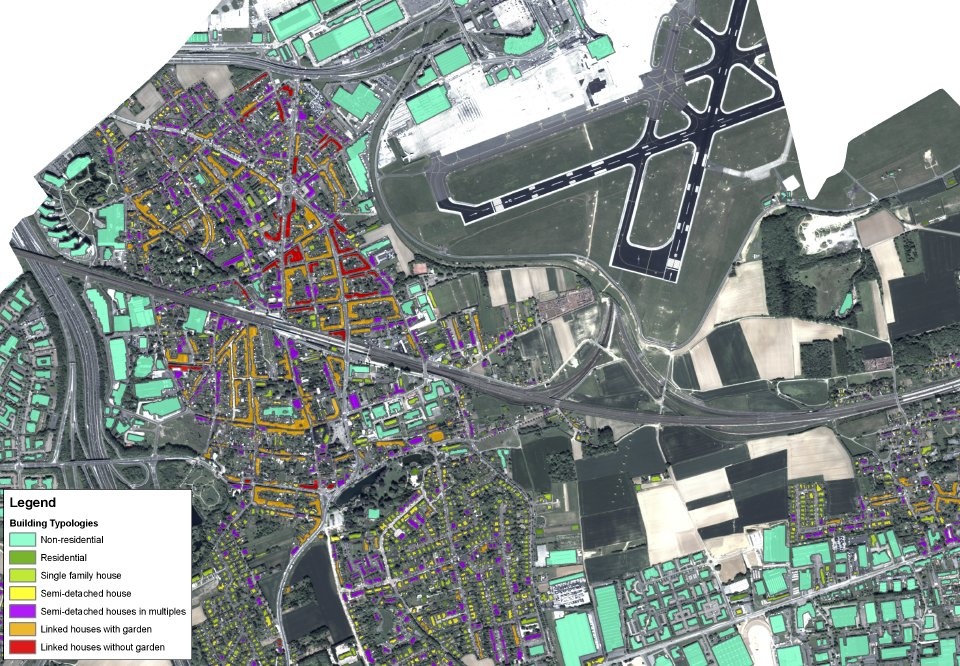
Land cover product for the city of Riga, Latvia with a detail of the city centre. Credits: Urban Atlas. | Urban sprawl map of the Rome area showing 'hot spots' (in red) of new urbanisation between 1995 and 2000. The white colour indicates built-up areas existing in 1995. Credits: ACS. | Land use map with building inventort on building block level in Laos. Credits: GeoVille. |

The geometric accuracy is usually comparable to the spatial resolution of the input satellite data, i.e. typically a few metres. The thematic (classification) accuracy is in the range of 80–90% depending on the quality of the EO data. In the case of building inventories, only part of the building information can be captured, depending on the sensors used for data acquisition. Very high resolution optical sensor imagery makes it possible to estimate building footprints, building location, distance from building to building, building height classes (using stereo image pairs). Other features, such as building height as number of storeys, building material, structure type, load bearing structure system, construction technique, floor area, are more difficult to capture.
Basic urban mapping products offer a sound basis for spatial statistic calculations and revision of urban plans for urban planners, politicians, environmentalists and other public stakeholders for planning and management of cities. The service is particularly relevant for monitoring urban expansion / urban sprawl adjacent to cities. These areas are often the most dynamic, and have a large impact on city planning and development.
Furthermore, the products serve as a starting point for a range of urban indicators for soil protection and management as well as the monitoring of crucial water supply systems, urban structures, and flood risk control. In general, the products are independent and up-to-date, available practically around the globe. The products also are reproducible and thus consistent and comparable. Especially for urban areas in developing countries, EO information services and products often remain the only data source. While the EO products rarely achieve the accuracy of cadastral data, their accuracies are sufficiently high to form an objective basis for decisionmaking.
The Sentinel-2 mission will routinely provide highresolution (10–20 m) optical images globally with frequent revisits (12 days). It is anticipated that the current number of space-based optical imaging sensors will keep increasing, and include relatively affordable small satellite systems with very high resolution sensors operated by a growing number of countries. Together with sensors like Sentinel-2, these will ensure the long-term continuity of medium-, high- and very highresolution data, creating the possibility of urban studies across many decades.
References:
ESA 2013, Earth Observation for Green Growth: An overview of European and Canadian Industrial Capability