
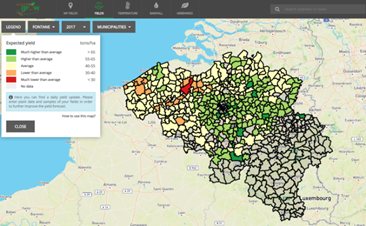
Example Image (watchitgrow.be) | ||||||||||
Category | ||||||||||
PRODUCT DESCRIPTION | ||||||||||
EO based yield models are integrators of various data sources, for example vegetation indices to estimate the crops’ phenology and meteo data derived from weather satellites. Several methods exist to estimate yield from EO data. Operational initiatives exist such as the EU Joint Research Centre (JRC) Mars Crop Yield Forecasting System (MCYFS), using agro-meteorological modelling (Crop Growth Monitoring System, CGMS) and statistical analysis tools. At local level, operational yield estimates at the farm level are available from commercial service providers. Besides the operational applications, a wide spectra spectrum of crop models is available which use EO data as inputs. A commonly used is the SAFY model of CESBIO (Duchemin et al., 2008). Recent developments make use of artificial intelligence to upscale or extrapolate ground collected yield data over larger areas. Yield estimation models (for a wide variety of crops) are among the key priorities of the global agricultural insurance sector, as insuring yield may be referred as all-peril crop insurance. Existing pilot models continue their development while service providers are calibrating yield estimation models with in-situ data applying machine-learning and other technologies (e.g.: rice (Philippines, Indonesia, China)). Combination of other EO services (e.g. field delineation, crop identification, NDVI, etc.) with yield estimation models provides a broad range of applications in all agricultural insurance business processes and product cycle activities. Being important at all product cycle stages, it is highly important for a more robust underwriting and loss adjustment processes. | ||||||||||
PRODUCT SPECIFICATIONS | ||||||||||
Main processing stepsYield estimation is generally based on either machine learning (e.g. deep learning) and/or process-based (i.e. crop growth models) modelling approaches. Both can make use of a range of input data sources including satellite imagery time-series (e.g. of vegetation indices and derived parameters e.g. emergence date) and meteorological data along with environmental parameters such as soil and crop type. Process based models also allow different scenarios to be simulated, e.g. with or without water- or nutrient stress. | ||||||||||
Input data sourcesOptical: Sentinel-2 Radar: Sentinel-1 Supporting data: in-situ calibration data (yield statistics, crop cutting experiments…) | ||||||||||
Spatial resolution and coverageSpatial resolution: 10m Coverage: Farm level till Watershed scale Availability: globally available | ||||||||||
Accuracy / constraintsThematic accuracy: depending on region and availability of in situ data Spatial accuracy: field level | ||||||||||
LimitationsThere are still no globally applicable yield forecasting models, mainly local pilots. | ||||||||||
Frequency / timelinessFrequency: daily Timeliness: near real-time | ||||||||||
Delivery / output formatData type: yield estimates (ton/ha). GIS-ready data formats; regional summaries, statistics, report sheets; API (depending on customer needs) File format: parcel level aggregated values (e.g. CSV) | ||||||||||
AccessibilityCommercially available on demand from EO service providers. | ||||||||||
CHALLENGES ADDRESSED - USE CASE(S) | ||||||||||
Product Development:
Underwriting:
Loss Adjustment:
Claims Handling: | ||||||||||
...