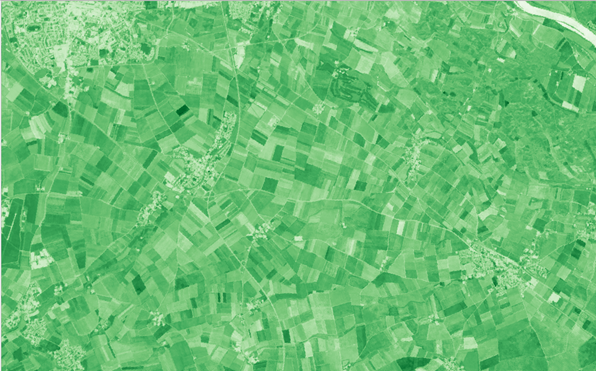
NDVI (Source: Sentinel-2) | ||||||||||
Category | ||||||||||
PRODUCT DESCRIPTION | ||||||||||
Monitoring the vegetation provides an important information on crop’s development and performance of fields. Information on the vegetation status and possible deviations at certain fields is important to identify the problem areas throughout the entire insurance season so that the farmer can react with application of necessary agricultural production technology and inputs to ensure the lesser effects of possible vegetation change in time, to ensure crop’s optimal growth and yielding capacity. Satellite based vegeation monitoring is typically done with vegetation indices, which Different vegetation indices serve as input for various applications and services of remote sensing-based analysis and products/services, such as the . A first group represents reflectance based indices, which are dimensionless indicators highlighting one or more surface characteristics (Normalized Difference Vegetation Index (NDVI) , Leaf Area Index (LAI), or Enhanced Vegetation Index (EVI) or )). A second group are biophysical parameters, representing a biophysical quantity such as the Fraction of Absorbed Photosynthetically Active Radiation (FAPAR) or Leaf Area Index (LAI). They are derived from satellite images using different bandsThe latter are generated with models that use the satellite reflectances as input. Consistent long time series are available on various spatial levels. The Normalized Difference Vegetation Index (NDVI) is an indicator of a dimensionless vegetation index, which provides information on the greenness of the biomasssurface. It is closely related to the Fraction of Absorbed Photosynthetically Active Radiation (FAPAR), and is little scale-dependent. Even though it is not a physical property of the vegetation cover, its simple formulation makes it widely used for ecosystem as well as vegetation monitoring. Depending on how the plant reflects light at certain frequencies the NDVI indicates the state of plant health. The Leaf Area Index (LAI) characterized the plant canopies. It is defined as half the total developed area of green photosynthetically active elements of the canopy vegetation per unit horizontal ground area. The LAI quantifies the thickness of the vegetation cover. Vegetation indices are widely applied in insurance industry for product development, underwriting and loss adjustment purposes.It determines the size of the interface for exchange of energy (including radiation) and mass between the canopy and the atmosphere. This is an intrinsic canopy primary variable that should not depend on observation conditions. fAPAR corresponds to the fraction of photosynthetically active radiation absorbed by the canopy . The FAPAR value results directly from the radiative transfer model in the canopy which is computed instantaneously. It depends on canopy structure, vegetation element optical properties and illumination conditions. Fraction of green vegetation cover (fCOVER) corresponds to the gap fraction for nadir direction. FCOVER is used to separate vegetation and soil in energy balance processes, including temperature and evapotranspiration. It is computed from the leaf area index and other canopy structural variables and does not depend on variables such as the geometry of illumination as compared to FAPAR. For this reason, it is a very good candidate for the replacement of classical vegetation indices for the monitoring of green vegetation. | ||||||||||
PRODUCT SPECIFICATIONS | ||||||||||
Main processing stepsThe NDVI is calculated by normalizing the spectral reflectance that are measured in the near infrared (green leaf scattering) and red (chlorophyll absorption) wavebands of satellite imagery. LAI, fCOVER and fAPAR are typically modelled. | ||||||||||
Input data sourcesOptical: Sentinel-2, MODIS, PROBA-V Radar: n.a. Supporting data: n.a. | ||||||||||
Spatial resolution and coverageSpatial resolution: >10m Coverage: global Availability: globally available | ||||||||||
Accuracy / constraintsThematic accuracy: n.a. as indices are calculated directly on the basis of raw measurements Spatial accuracy: Absolute geolocation is constantly monitored for S2A and S2B; the long-term performance is close to 11 m at 95% for both satellites. For the geolocation accuracy for PROBA-V satellites please refer to http://proba-v.vgt.vito.be/en/quality/platform-status-information/geolocation-accuracy. | ||||||||||
LimitationsAtmospheric effects and clouds can affect the calculations and may lead to misinterpretation. | ||||||||||
Frequency / timelinessFrequency: various time steps and historic archive Timeliness: near real-time | ||||||||||
Delivery / output formatData type: GIS-ready data formats; Raster File format: GeoTIFF | ||||||||||
AccessibilityProducts with higher resolution are commercially available on demand from EO service providers. Products with higher resolution are commercially available on demand from EO service providers. The Copernicus Global Land Service has been providing operationally global products of biophysical parameters such as NDVI, FAPAR, fcover, … from Proba-V satellite imagery. This service will switch to Sentinel 3 data (from Q2 2020 onwards) to The mission ended in June 2020. The Sentinel-3 will ensure data continuity for its users. These data provide both long historical archives (1999 – today), which could be used for historical analyses and near real time monitoring at medium resolution scale. https://land.copernicus.eu/global/. Terrascope (terrascope.be) provides operationally biophysical parameters over Europe. | ||||||||||
CHALLENGES ADDRESSED - USE CASE(S) | ||||||||||
Product Development:
Product Sales:
Underwriting:
Loss Adjustment:
Claims Handling: | ||||||||||
...