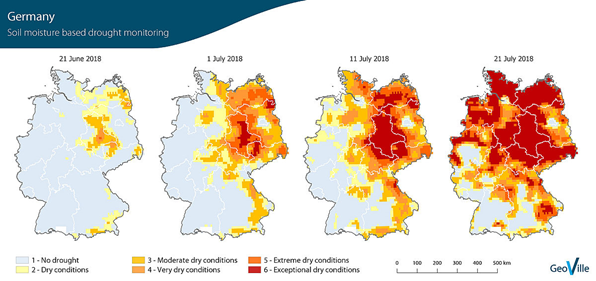
Soil moisture-based drought monitoring, June–July 2018, Germany (Source: GeoVille) | ||||||||||
Category | ||||||||||
PRODUCT DESCRIPTION | ||||||||||
Droughts are prolonged periods of time when an area or region receives shortages in the water supply, whether atmospheric (below-average precipitation), surface water or ground waterDrought may have several dimensions but for agro-insurances, agricultural drought is most relevant. This is considered when the soil moisture availability to crops has dropped to such a level that it adversely affects the crop yield. In most cases drought is referred as a large-scale (systemic) risk, as it covers larger production areas affecting all farms and crops in the region. Although the early effects of droughts are hard to identify, the longer a drought persists the greater are the effects for crops, if they are irrigated or not. Drought indicators are variables or parameters used to describe drought conditions. Examples include precipitation, temperature, streamflow, groundwater and reservoir levels, and soil moisture. Drought indices are typically computed numerical representations of drought severity, assessed using climatic or hydrometeorological inputs including the indicators listed above. They aim to measure the qualitative state of droughts on the landscape for a given time period. Indices are technically indicators as well. EO data correlation with the actual drought conditions for specific crops represents the major challenge for the industry. Different crop types (and their varieties) may react differently to drought effects, showing different yield capacity decrease, which requires additional calibration of drought datasets and parameters interpretation by algorithms for the needs of a specific crop (insurance) needs. | ||||||||||
PRODUCT SPECIFICATIONS | ||||||||||
Main processing stepsDrought indices are amongst others based on long time series of rainfall, soil moisture and vegetation data. Anomalies compared to the long-term average highlighting areas under drought conditions. | ||||||||||
Input data sourcesOptical: Sentinel-2, Landsat-8, MODIS, Geostationary satellites (IR/visible) Radar: MetOp ASCAT, SMAP, TRMM, SSM/I Supporting data: in-situ information of drought parameters | ||||||||||
Spatial resolution and coverageSpatial resolution: 10 m – 25 km Coverage: National/regional/local level Availability: globally available | ||||||||||
Accuracy / constraintsThematic accuracy: depending on observed variable. Spatial accuracy: depending on observed variable. | ||||||||||
LimitationsDepending on the drought indicator/index the limitations vary. A good overview on nearly 50 indicators/indices is provided in this WMO publication: https://www.droughtmanagement.info/literature/GWP_Handbook_of_Drought_Indicators_and_Indices_2016.pdf | ||||||||||
Frequency / timelinessFrequency: daily and more at regular intervals Timeliness: near real-time | ||||||||||
Delivery / output formatData type: Raster formats File format: GeoTIFF, NetCDF | ||||||||||
AccessibilityCommercially available on demand from EO service providers. Publicly available data can be obtained through the Copernicus European Drought Observatory (https://www.copernicus.eu/en/european-drought-observatory). | ||||||||||
CHALLENGES ADDRESSED - USE CASE(S) | ||||||||||
Product Development Index insurance:
Product Sales:
Underwriting:
Loss Adjustment
Claims Handling | ||||||||||
...