EO Products / Icing forecasting

Time-series of potential icing areas.
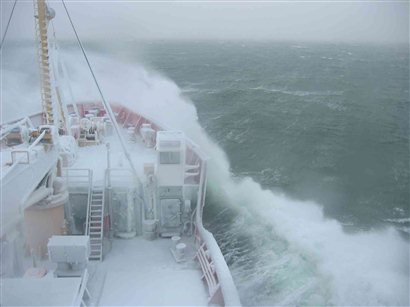
Photo: Fisheries and Oceans Canada / Canadian Coast Guard.
(Source: Source https://wwwuit.mdpi.com/2072-4292/10/4/631)no/project/sprice/about_this_project.
Product Description
Forecast of marine icing condition could assist vessels in route planning, avoidance or give the crew time to plan appropriate risk reducing measures and prepare for the icing conditions.
There are different types of predictive models of sea spray icing on marine vessels, such as empirical, semi-empirical, analytical, and numerical models. Empirical models are based on experimental data and correlations, while semi-empirical models combine empirical data with physical principles. Analytical models are based on mathematical equations that describe the physical processes of sea spray icing, such as droplet trajectories, heat transfer, and ice accretion. Numerical models are based on computational fluid dynamics synamics (CFD) simulations that can capture the capturing complex fluid-structure interactions structiure interaction and the effects of wind, waves, wave and vessel motion, see Marine icing phenomena on vessels and offshore structures: Prediction and analysis (trb.org).
Many of those studies have focused on icing prediction systems, but a knowledge gap exists in the detection of sea spray using remote sensing data. The recent availability of data from new and advanced imagers, such as JPSS Visible Infrared Imaging Radiometer Suite (VIIRS), offers new tools for the detection and tracking of sea spray for forecasters. VIIRS contributes to higher spatial detail, allowing for improved analysis of sea spray extent, particularly within smaller bodies of water. Forecasters can implement these detection techniques to help verify sea spray–related forecast products, and to pass along potentially life-saving information to their mariner core partners.
The prediction of icing rate and forecasting icing events are challenging to uncertainties related to e.g., accurately estimating the spray amount, modelling turbulent heat transfer between the atmosphere and wetted surfaces on the ship, estimating brine salinity and, therefore, the freezing temperature. In addition, documented icing events required for model verification, forecasting oceanographic and meteorological parameters, that affect the spray-icing process, are limited (Naseri & Samuelsen, 2019). The incorporation in the model of vessel characteristics, including geometry of vessel/platform-wave interactions, location of equipment and facilities on-board are other parameters makes spray ice modelling even more complex. An example of a ship-icing model is the MINCOG model, which uses gridded meteorological and oceanographic data as input to estimate the ice accretion rate on vessels operating in the Arctic waters, see https://uit.no/project/sprice/about_this_project.
Product Specifications
BUSINESS PROCESS | SC, IN, SO |
DESCRIPTION | Forecast marine ship-icing due to sea spray icing and atmospheric icing |
EO INFORMATION OF INTEREST | Time series of: · wind speed, · air temperature, · sea temperature, · salinity, · wind speed, · air temperature, · relative humidity, · mean-sea level pressure, · significant wave height, · significant wave period |
MAIN PROCESS STEPS | Modelling of wave-ship interaction, use of a ship class e.g. KV Nordkapp as a reference ship type for ship-icing calculations, assimilation of atmospheric, and ocean data for which is necessary geocoding, radiometric calibration, data modelling assimilation. |
INPUT DATA SOURCE | Electro Optical satellite data, radiometer, altimeters |
SPATIAL RESOLUTION AND COVERAGE | 50x100km, finer grids are possible if higher-resolution input data are available. |
ACCURACY / CONSTRAINS | Strongly dependent on the: · accuracy of input of gridded meteorological and oceanographic data. · representation of modelling complexity of the physical processes related to ice accretion, such as air temperature, wind speed, sea surface temperature, and ocean currents. · validation against observational data (e.g., ship icing measurements). · limited spatial resolution |
LIMITATIONS | · Simplified Physics: e.g., steady-state conditions (not account for transient effects). · Inaccuracy of capturing local variability (e.g., coastal effects, fjords, narrow straits). · Propagation of uncertainties in input data, parameterizations, and model assumptions. · Assumption of homogeneity within each grid cell. In reality, local variations (e.g., icebergs, leads, polynyas) can impact ice accretion. · Limited Observations: Ship icing measurements are sparse, limiting the availability of validation data. · Model’s accuracy may be affected by changing climate conditions, especially in the Arctic region. |
TEMPORAL RESOLUTION | The model calculates the icing rate for each 3-hour time interval and then aggregates the results to daily, monthly, or annual values. |
FREQUENCY UPDATE | The frequency of data updates depends on the source: e.g. The MINCOG model uses 3-hourly data from the NORA10 data reanalysis. Other data sources may have different update frequencies. |
DELIVERY / OUTPUT FORMAT | NetCDF-3, NetCDF-4 |
ACCESSIBILITY | Variety of data layers are availble from Copernicus Marine service and commercial providers, commercial Electro Optical data providers. |