...
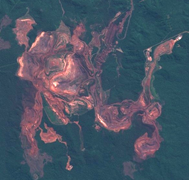
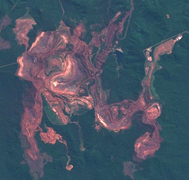
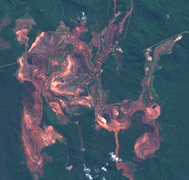
Land progressively rehabilitated | ||||||||
Observation in time (July 2016, 2017 and 2019) of mining and rehabilitation activities at the Carajas mine, Brazil, with the help of Sentinel-2 images (source: Sentinel Hub). | ||||||||
PRODUCT DESCRIPTION | ||||||||
Category | ||||||||
|
| |||||||
Uses | ||||||||
Design, Construction & Operations
Mine Closure & Aftercare
| ||||||||
Challenges addressed | ||||||||
| ||||||||
Geo-information needs | ||||||||
| ||||||||
Description | ||||||||
The modern approach to managing sustainability is to adopt a strategy of progressive rehabilitation - where the mine operator rehabilitates lands on an ongoing basis. In other words, the land disturbed by mining activities is progressively returned to its original state or agreed endpoint. Remote sensing data (such as optical and infrared imagery products) help in assessing the evolution (in time) of the land cover and the conducted rehabilitating steps by the mine operator. The manual interpretation of the imagery products allows for the digitalization of the nature of the ongoing rehabilitation steps and when they are being conducted. This product provides key information for the demonstration of rehabilitation/revegetation of the mining site to its original state. Several optical sensors onboard satellites mentioned in the input data sources table (with varying spatial and time resolutions) can be used to detect the land progressively rehabilitated (dependent on the resolution required by authorities). Digitalization steps of the progressively rehabilitated land can be conducted by the direct ingestion of optical images into Geographic Information Systems software such as GIS and QGIS. Additionally, the coupling of infrared and visible imagery products can be used (e.g., Landsat-8; SPOT-6 and 7) to estimate how well a previously disturbed land is rehabilitated to its original state (via for example the generation of vegetation index map products). | ||||||||
Known restrictions / limitations | ||||||||
In period of intense rehabilitation, a more frequent monitoring and a shorter period between reports might be required. Depending on the geography, climate and season, cloud coverage might be an issue in the investigation of the evolution of the rehabilitation and revegetation steps. A clear collaboration between the mining and mapping authority is required in order to correctly identify the steps conducted to rehabilitate progressively the land disturbed. The occurrence in time of such steps is vital in order to exactly quantify the re-growth period (how long it takes the vegetation to recover from the conducted disturbances). | ||||||||
Lifecycle stage and demand | ||||||||
Exploration | Environmental Assessment and Permitting | Design, Construction and Operations | Mine Closure and Aftercare | |||||
| ■■■■ | ■■ | ||||||
Environmental Assessment & Permitting:
Design, Construction & Operations:
Mine Closure & Aftercare:
| ||||||||
Geographic coverage | ||||||||
| Demand and coverage is global. | ||||||||
EARSC Thematic Domain | ||||||||
Domain | Land | |||||||
| Sub-domain | Land use | |||||||
| Product description | Monitor land cover and detection change | |||||||
PRODUCT SPECIFICATIONS | ||||||||
Input data sources | ||||||||
| Satellite | Sentinel-2 | Landsat-8 | GeoEye-1 | Worldview-1, 2 and 3 | SPOT 6, 7 | Pleiades | ||
| Status | In operation | In operation | In operation | In operation | In operation | In operation | ||
| Operator | ESA | NASA | Digital Globe | Digital Globe | Airbus | Airbus | ||
| Data availability | Public | Public | Commercial | Commercial | Commercial | Commercial | ||
| Resolution (m) | 10-60 | 15-100 | 0.46 | 0.31-0.46 | 1.5 | 0.5 | ||
| Coverage | Global | Global | Global | Global | Global | Global | ||
| Frequency (days) | 5 | 16 | < 3 | < 2 | < 1 | < 1 | ||
| Launch year | 2015 | 2013 | 2008 | 2007/2009/2014 | 2012/2014 | 2011 | ||
Website | link | link | link | link | link | link | ||
NOTE: Airborne and drone imagery products (optical and infrared) for local and regional analysis might also be used in order to obtain higher image resolution. NOTE 2: Most of the satellite operator provide images under raster type of formats such as “.tif” files. Satellite products are often gathered into a single product containing several bands (i.e., images obtained at different wavelengths). | ||||||||
Minimum Mapping Unit (MMU) | ||||||||
Minimum detectable feature size (dependent on input pixel resolution, ~1 - 3 px) | ||||||||
Accuracy / constraints | ||||||||
Thematic accuracy: Progressively rehabilitated area should be detected from optical imagery in most cases (> 90%) if the area is larger than the minimum detectable feature size. Spatial accuracy: Dependent on input pixel resolution; typically ~0.5 - 1 pixel. | ||||||||
Accuracy assessment approach & quality control measures | ||||||||
Dependent on input pixel resolution; typically ~0.5 - 1 pixel. | ||||||||
Frequency / timeliness | ||||||||
Digitization of ongoing rehabilitation steps from imagery products can be completed within a few hours/days of work, dependent on how large the rehabilitated area disturbed by mining activities is. Ongoing rehabilitation changes likely to be reported on a weekly to yearly basis. | ||||||||
Availability | ||||||||
Data from Sentinel satellites are freely available through the open data policy of the European Space Agency. Data is made available typically within 6-12 hours of satellite fly-over (similar for Landsat through NASA open data policy). GeoEye-1, Worldview, SPOT and Pleiades data are commercially licensed and must be purchased through operator/vendor. Usually available within hour(s) of satellite fly-over. Airborne and drone imagery products can be purchased through operator/vendor. Usually available within hours or days after acquisition. | ||||||||
Delivery / output format | ||||||||
Rehabilitation steps Map showing the evolution (in time) of the rehabilitation steps at the mining site Output: vector formats - shapefile, report on key indicators, client-specified spatial formats Land cover Map showing the evolution of land cover in time (as a response to the rehabilitation steps) Map showing the evolution of the vegetation in time (vegetation index) Output: vector and raster formats - shapefile, GeoTiff, client-specified spatial formats. | ||||||||
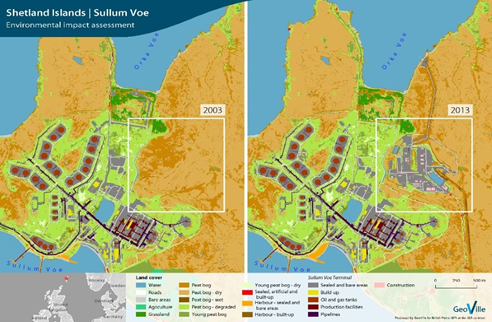
USE CASE | ||||||||
Source: GeoVille Shetland Islands – Environmental impact assessment The aim of this project was to support environmental impact assessment and to provide guidance to minimize ecological impacts and to value ecosystem services in the region. A detailed very high-resolution land cover and land use classification was provided. The examples were used to identify valuable ecosystem services, to recognize ecosystem services dependencies and the impact caused by the operations. This method may also be applied to map the vegetation and land progressively rehabilitated during mining operation. | ||||||||