In Europe the largest cause for failures of transmission gas pipelines are Third Party Interferences (TPI). Only 47% are detected. We introduce surveillance by EO/SAR satellites with high revisit frequencies as a solution to improve detection rates, on top of the existing surveillance methods. Notifications of TPI are automatically generated after each revisit of the pipeline route by a satellite and sent via a secured Internet connection to a client system. Here these notifications can be correlated with the results of other surveying methods (e.g. helicopter reports, etc.) and other available information (e.g. planned Third Party Activities, etc.). Mutual interpretation of all this information results in more complete, comprehensive and timely knowledge of all external threats to a pipeline system.
![]()
In Europe the main cause for failures in high pressure gas transmission pipelines is Third Party Interference (TPI). Only 47% of these failures are detected by professionals. PIMSIS intends to increase these numbers dramatically by adding surveillance by EO/SAR satellites to the existing portfolio of surveillance methods.
Currently inspections of pipelines are performed by helicopters, cars and walking along the pipeline route. Recently other systems are introduced which detect possible threats by e.g. sensing pipelines via fibre-optic cables or with acoustic sensors. To these surveying methods for detection of TPI we add surveillance by EO/SAR (Earth Observation/ Synthetic Aperture Radar) satellites with high revisit frequencies. By integrating space based technologies with terrestrial systems we aim (i) to improve regularity and effectiveness of inspection operations, (ii) to increase safety and (iii) to eventually reduce costs for pipeline operators. This is realised by providing a system delivering the following integrated services:
- Detection of Third Party Interference (TPI), which mostly are threats related to excavation / construction activities and building of settlements near pipelines. These activities are detected through change detection techniques applied to successive EO/SAR satellite images. The system also allows to correlate detected changes via satellites with known third party activities, helicopter reports and results of other surveying methods.
- Measuring ground elevation movements which are related to erosion, subsidence, and early detection of landslides and sink holes. Monitoring will be performed through Permanent Scatterer Interferometry (InSAR) techniques applied to a stack of EO/SAR satellite images. InSAR techniques can accurately measure slow varying movements with an accuracy of millimetres per year.
- Guidance via a tablet computer of field operators to the exact field location where threats have been identified and enabling them to record visual evidences (photo’s, reports). The exact location of the recordings of visual evidences will be geo-tagged and transmitted in real-time to the central system.
- Monitoring pipeline health status of the pipeline by measuring in-situ sensors installed along the pipeline infrastructure.
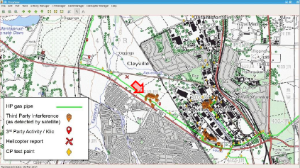
Figure 1: Screenshot of PIMSiS desktop with description of displayed objects
Today the detection rate of TPI related failures is to low. PIMSiS can significantly increase TPI detection figures when used in combination with existing surveillance methods and already available information.
In Europe the main cause for failures in high pressure gas transmission pipelines is Third Party Interference (TPI). Figure 1 below shows that TPI is responsible for almost 50% of all failures. Other important causes are corrosion and ground movements. For the USA (Figure 2) the situation for high pressure gas transmission pipelines is different. Here material failure is the largest cause and TPI the second. But we should also look at the failure frequency specifically caused by TPI, the values (per 1.000 km x year) are: 0.079 for Europe and 0.111 for the USA. So although in the USA TPI is not the largest cause for failures, TPI results in more failures per 1,000 km pipeline than in Europe.
Another important question is who detects failures in high pressure gas transmission pipelines (see Figure 3). By far most of the failures are detected by the public. Since the category ‘landowners’ is also public over 40% of the failures is detected by the public and only 47% by professionals.
So we conclude that with respect to integrity management of transmission pipelines there are two major areas where improvement is urgently required:
- Surveying methods to detect TPI, to prevent unknown third party activities to become real threats to the integrity of the transmission pipeline.
- Better methods to monitor the system health of transmission pipeline systems. These methods analyse and process in real-time data from in-situ sensors installed along the pipeline (e.g. P, T, flow, CP, etc.) to early detect or even predict conditions which can result in failures.
Orbital eye is developing solutions for both areas. PIMSiS is a solution for an increased detection of TPI, which can be easily integrated with already available information.
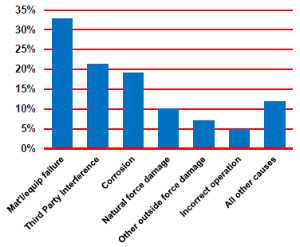
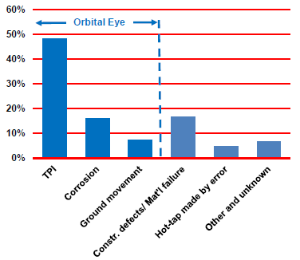
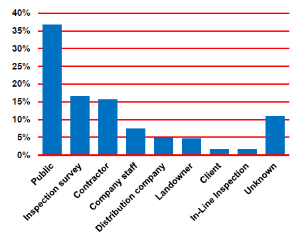
Figure 1: Causes for pipeline failures in Europe (EGIG, 2011).
Figure 2: Causes for pipeline failures in USA (PHMSA, 2011).
Figure 3: Detection of pipeline failures (EGIGi, 2011)
With the PIMSiS processing chain we automatically generate Third Party Interference (TPI) notifications for every new revisit of the pipeline route by the EO/SAR satellite. These TPI notifications are via a secured internet connection automatically delivered to either an existing pipeline integrity management system owned by the client or to a system provided by Orbital Eye.
Orbital Eye’s desktop & tablet system supports a GIS application which can manage the following object and display their locations on a geographic map:
- Pipeline system (as build, inclusive all stations)
- TPI notifications (locations and quality measure)
- Planned 3rd Party Activities (incl. planning info and design documents)
- Helicopter reports
- CP stations and measuring points (incl. CIS and CSVG surveys)
- Pipeline repairs
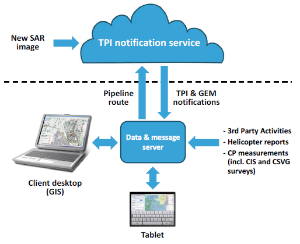
Figure 1: PIMSiS - System overview
Information related to each object can be selected in the GIS application, retrieved from the database and displayed on the screen. Both desktop and tablet computer share the same database, so data integrity is maintained between desktop system and tablet. Both desktop and the tablet allow clients to visually correlate TPI notifications with known 3rd Party Activities, helicopter reports and CP data. The tablet can also be used in the field to support the validate and document TPI notifications and update information to registered planned 3rd Party Activities (including reports, photos and videos).
Via a notification inbox users of both desktop and clients are informed when after a revisit of the satellite new TPI notifications arrive.
Planned 3rd Party Activities, helicopter reports, CP data and pipe repair information can be automatically uploaded into the database. A business process is implemented for the processing of applications for planned 3rd Party Activities.
Examples of TPI detection via EO/SAR satellites
The picture below is a screen shot of the PIMSiS desktop system. Added is a description of the various symbols displayed in the picture. Clearly visible are three clusters of TPI notifications.
Figure 2: Screenshot of PIMSiS desktop view with description of displayed objects
These results were part of a blind test, so no prior ground truth information was available. The images used to detect TPI were acquired in July 2013 and December 2013, so with a difference of 5 month. The images are acquired with the TerraSAR-X satellite. For the location with the red arrow we received ground truth information after we presented the results of this experiment to the owner of the gas transmission pipeline. It turned out that during 2013 at this location a shopping mall was built (Figure 3). Please note that for unknown reasons some shops in the right image are blanked.
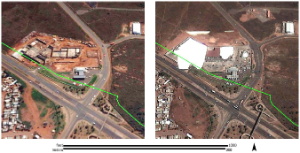
Figure 3: Ground truth at red arrow in Figure 11 (left image 25/4/2013, right image 9/11/2013)
PIMSIS detects TPI by comparing detected events in an EO/SAR reference image with detected events in a new acquired EO/SAR image.
For this we did implement a processing chain with the following steps:
- The construction of a reference image starts by retrieving from the image store of the satellite provider one or more images covering the complete pipeline route to be monitored. The images are pre-processed to correct for differences in terrain elevation and differences in satellite orbits. Then the actual reference image is constructed by cutting a strip around the route of the pipeline to be monitored. The reference image can be based on one or more images acquired at a specific date but may also, for a stable area, be based on images acquired at 2 or 3 successive dates (for suppression of noise). Additional the following processing steps are applied to the reference image.
- Using phase signatures manmade structures are separated from the natural environment.
- Manmade structures are detected (target detection).
- When after a revisit by the satellite new images of the pipeline route become available these images are retrieved from the image store of the satellite provider. The same pre-processing and processing steps are applied as described above. Subsequently the detected targets in the new acquired images and in the reference image are compared. Also a second detection algorithm is applied based on the coherence between the new acquired image and the reference image.
- Than the differences in detected targets (i.e. appearances or disappearances of events) are sent as notifications via a secure internet connection to a pipeline integrity management system at the site of our clients. The notifications have a location and a quality measure, which describes the quality of the detected changes.
- The new acquired images becomes (part of) the reference image and we continue to step 2 of the processing chain.
The complete PIMSiS processing chain as described above operates in a fully automatic manner, including a number of quality controls to test intermediate results and to optimise specific parameters of the algorithms applied to the data.
Target satellites
For our PIMSiS services we use EO/SAR satellites or constellations of EO/SAR satellites with the following characteristics:
- High revisit frequency.
- Wide swath (i.e. the width of the image).
- Reasonable geographic resolution.
For our PIMSiS services we initially selected as target satellites the constellation of the two ESA Sentinel-1 satellites (Sentinel-1A and -1B) which fulfil these requirements in combination with fast data delivery and free access to data. ESA will launch Sentinel-1A in April 2014 and Sentinel-1B in the second half of 2015.
Currently we are expanding our processing chain from data sourcing from a single EO/SAR platform to data sourcing from multiple, different EO/SAR platforms (including the constellations of TerraSAR-X and COSMO-SkyMed satellites and the RadarSAT-2 satellite). This new processing chain will also allow us to use both ascending and descending orbits of EO/SAR satellites.
With the new processing chain we can dramatically increase the update frequency of the notifications for Third Party Interferences and also offer a flexibility in resolution and costs for satellite data.
Results from development phase
The test site presented here was located in Monster, south of The Hague and close to the North Sea shore. The Monster test site is an area for urban development, due to the financial crisis in 2013, it is at the time of testing without any construction activity. The soil is sand (see Figure 1).
We used data acquired in standard mode by the EO/SAR satellite RadarSAT-2. The standard mode of RadarSAT-2 has very similar specifications as the target satellite constellation Sentinel-1.
For every revisit of the RadarSAT-2 satellite we did simulate at these test sites all kind of Third Party Interference events. The acquired satellite images were used to develop and optimise our processing chain.
Figure 2 is the ground truth map for the Monster test site for the revisit of the RadarSAT-2 satellite on 01/09/2013.
After applying our processing chain we did detect the TPI targets (Figure 3). The objects are represented by the red pins in the image. By studying successive images we were able to detect changes (i.e. appearing or disappearing of TPI targets). It is to be noted that the PIMSiS processing chain we can separate manmade objects from responses from the natural environment.
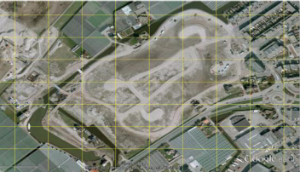
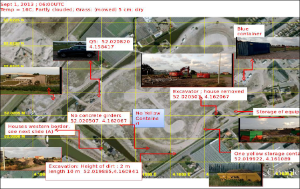
Figure 1: Monster test site 1
Figure 2: Ground truth map for 01/09/2013
Figure 3: Automated target detection 01/09/2013
Contact info
Jan Ridder | ridder@orbitaleye.nl
Managing director
Orbital Eye BV - Pipeline Integrity Management from Space
Olof Palmestraat 14, 2616LR Delft, The Netherlands
PO Box 608, 2600 AP Delft, The Netherlands
T: +31 15 262 98 89
M: +31 6 533 91 550
W: www.orbitaleye.nl
![]()
This page has no comments.
0 Comments